
In short ⚡
An Acceptable Sampling Plan is a statistical quality control method that defines the number of units to inspect from a batch and the maximum allowable defects before accepting or rejecting the entire shipment. This inspection protocol balances cost-efficiency with quality assurance in international trade.
Introduction
How many units should you inspect before accepting a 10,000-piece shipment? This question confronts every importer facing quality control decisions. Inspecting everything is prohibitively expensive, while random checks risk accepting defective batches.
The Acceptable Sampling Plan resolves this dilemma through mathematical probability. It establishes inspection protocols that protect buyers while maintaining commercial feasibility. This methodology forms the backbone of international quality standards.
- Statistical foundation: Based on probability theory and acceptable quality limits
- Sample size determination: Calculated according to batch size and risk tolerance
- Accept/reject criteria: Clear thresholds for decision-making
- Risk quantification: Balances producer’s risk versus consumer’s risk
- International standardization: Governed by ISO 2859 and ANSI/ASQ Z1.4 standards
Technical Framework & Regulatory Context
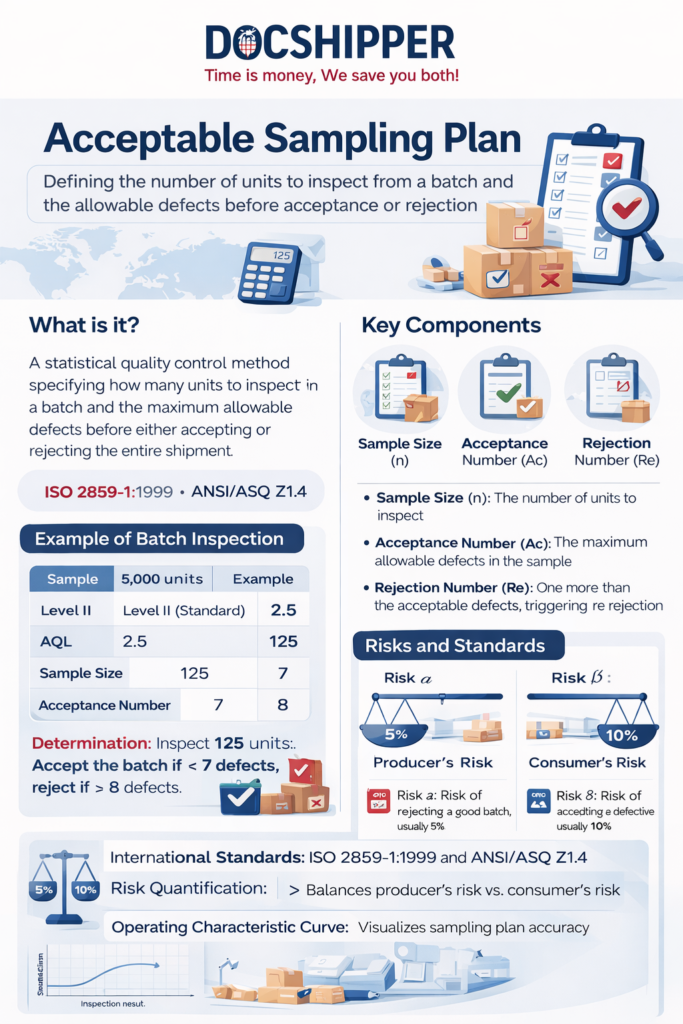
An Acceptable Sampling Plan operates through three fundamental components: the sample size (n), the acceptance number (Ac), and the rejection number (Re). The sample size represents the quantity of units randomly selected for inspection. The acceptance number defines the maximum allowable defects within that sample before the batch is rejected.
The Acceptable Quality Limit (AQL) serves as the cornerstone parameter. AQL represents the maximum percentage of defective items considered acceptable as a process average. Common AQL levels range from 0.065% for critical defects to 6.5% for minor cosmetic issues. The stricter the AQL, the larger the required sample size.
Two types of risk govern sampling plans: producer’s risk (α) and consumer’s risk (β). Producer’s risk represents the probability of rejecting a good batch, typically set at 5%. Consumer’s risk indicates the probability of accepting a defective batch, usually maintained at 10%. These parameters shape the statistical curves that determine sampling protocols.
International standards provide ready-to-use sampling tables. ISO 2859-1:1999 offers comprehensive inspection tables for attributes sampling. These tables correlate batch sizes with inspection levels (I, II, III) and AQL values, eliminating complex calculations for practitioners.
At DocShipper, we implement these sampling plans during pre-shipment inspections across manufacturing facilities worldwide. Our quality control teams apply ISO-compliant protocols to ensure shipments meet contractual specifications before ocean or air freight departure.
The Operating Characteristic (OC) curve visualizes a sampling plan’s performance. This graph plots the probability of acceptance against the actual defect rate in the batch. A steep OC curve indicates strong discrimination between good and bad lots, while a flat curve suggests weak differentiation—a critical consideration when selecting inspection stringency.
Practical Implementation & Data-Driven Examples
Consider a textile importer receiving 5,000 garments from a Vietnamese manufacturer. Using inspection level II (standard) with AQL 2.5 for major defects, ISO 2859 prescribes a sample size of 200 units with an acceptance number of 10. If inspectors find 10 or fewer defective items, the batch passes. Finding 11 defects triggers rejection.
| Batch Size | Inspection Level | AQL | Sample Size | Acceptance Number |
|---|---|---|---|---|
| 500 units | II (General) | 1.5 | 80 | 3 |
| 3,000 units | II (General) | 2.5 | 125 | 7 |
| 10,000 units | III (Reduced) | 1.0 | 200 | 5 |
| 50,000 units | I (Reduced) | 4.0 | 315 | 21 |
Electronics importers typically employ zero-acceptance sampling for safety-critical components. A shipment of 2,000 lithium batteries might require inspecting 125 units with Ac=0. A single defective battery fails the entire batch, reflecting the catastrophic risks associated with battery failures during air transport.
The financial impact proves substantial. Inspecting 200 units from a 5,000-piece shipment costs approximately $400-600, while accepting a defective batch averaging 5% defects could generate $15,000 in returns, rework, and brand damage on a $300,000 order. The sampling plan investment delivers a 25:1 risk mitigation ratio.
Sequential sampling offers advanced efficiency. Instead of fixed sample sizes, inspectors evaluate units progressively, making accept/reject decisions as soon as statistical confidence thresholds are met. This approach can reduce inspection quantities by 30-50% when quality is consistently good or obviously poor.
DocShipper’s quality control division processes over 12,000 inspections annually using adaptive sampling protocols. We adjust AQL levels based on supplier historical performance, tightening standards for new vendors while applying reduced inspection to proven manufacturers with six consecutive passed shipments.
Conclusion
The Acceptable Sampling Plan transforms quality control from guesswork into quantifiable risk management. By applying statistical rigor to inspection decisions, importers protect their investments while maintaining supply chain velocity. This methodology remains indispensable for international trade operations.
Need expert guidance implementing sampling plans for your shipments? Contact DocShipper for tailored quality control solutions across your global supply chain.
DocShipper Platform
Cut logistics costs. Not corners.
See exactly where your logistics costs are bleeding — and how to fix it. Book your expert demo.

📚 Quiz
Acceptable Sampling Plan
Q1 — What does an Acceptable Sampling Plan fundamentally define?
Q2 — A common misconception is that a well-designed sampling plan guarantees zero defects reach customers. What does it actually do?
Q3 — An electronics importer receives 2,000 lithium batteries for air freight. Which sampling approach should they apply?
🎯 Your Result
📞 Free Quote in 24hFAQ | Acceptable Sampling Plan: Definition, Application & Practical Examples
AQL (Acceptable Quality Limit) represents the maximum acceptable defect percentage as a process average, while the acceptance number indicates the specific quantity of defects allowed in a particular sample before rejecting the batch.
No. Different product categories require tailored AQL levels. Safety-critical items demand stricter standards (AQL 0.065-0.25), while minor cosmetic defects may accept AQL 4.0-6.5. Inspection level and sample size also vary by risk tolerance.
Larger batches require proportionally larger samples, but not linearly. A 1,000-unit batch might need 80 samples, while a 10,000-unit batch requires only 200—demonstrating the statistical efficiency gains as batch sizes increase.
The entire batch is rejected. Options include 100% screening inspection, rework by the supplier, price negotiation for discounted acceptance, or shipment return. The contract terms dictate financial responsibility for failed inspections.
Professional inspectors use systematic random sampling—selecting units at fixed intervals throughout the batch after a random starting point. This ensures representation across production runs while maintaining statistical validity and practical feasibility.
Review sampling plans quarterly based on supplier performance data. ISO 2859 recommends switching to reduced inspection after 10 consecutive acceptable lots, and tightened inspection after 2 out of 5 consecutive rejections.
Single sampling inspects one predetermined sample size. Double sampling allows a second smaller sample if the first yields borderline results, potentially reducing total inspection effort by 20-30% while maintaining statistical confidence.
No sampling plan eliminates all risk—only 100% inspection approaches that goal. Sampling balances cost against acceptable risk levels. A well-designed plan with AQL 1.0 typically limits consumer defect exposure to 1-3%.
Level II serves as the standard baseline for most commercial products. Use Level I for reduced inspection with trusted suppliers, and Level III for critical applications, new suppliers, or products with safety implications.
Producer's risk (typically 5%) represents the probability of rejecting a good batch. Lower producer's risk requires larger samples, increasing inspection costs but protecting supplier relationships by reducing false rejections of acceptable quality.
Yes. Service industries adapt sampling methodology to evaluate transaction accuracy, customer service interactions, or process compliance. The statistical principles remain identical, though measurement methods differ from physical product inspection.
Continuous production requires time-based or quantity-based sampling intervals rather than batch inspection. Control charts supplement sampling plans to monitor process stability, triggering investigations when statistical control limits are exceeded.
Need Help with
Logistics or Sourcing ?
First, we secure the right products from the right suppliers at the right price by managing the sourcing process from start to finish. Then, we simplify your shipping experience - from pickup to final delivery - ensuring any product, anywhere, is delivered at highly competitive prices.


Fill the Form
Prefer email? Send us your inquiry, and we’ll get back to you as soon as possible.
Contact us 

