In short ⚡
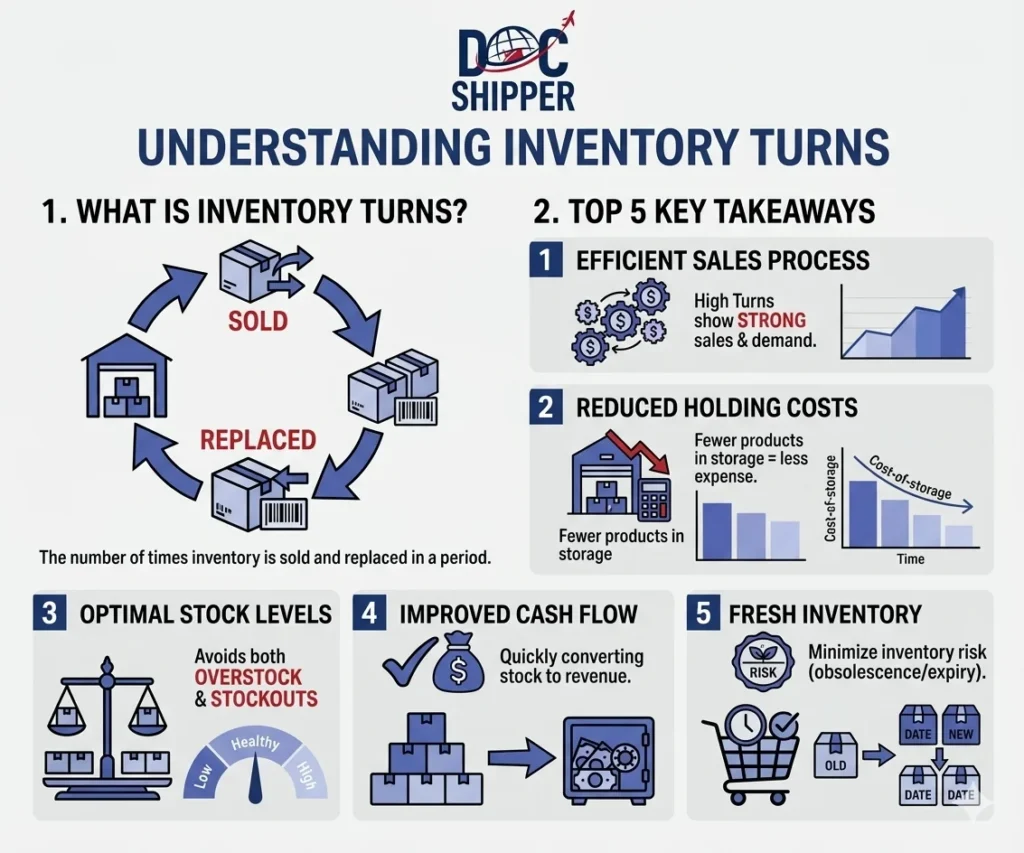
Inventory Turns (or Inventory Turnover Ratio) measures how many times a company sells and replaces its stock during a specific period. This critical logistics KPI indicates inventory efficiency, cash flow health, and demand forecasting accuracy in international trade operations.
Introduction
Many importers struggle to balance stock availability with capital efficiency. Holding too much inventory freezes cash, while insufficient stock causes sales losses. Understanding Inventory Turns solves this dilemma by quantifying how effectively your company converts inventory into revenue.
In global supply chains, this metric becomes even more critical. Long shipping times, customs clearance delays, and demand volatility make inventory management a strategic weapon for competitive advantage.
Key characteristics of effective inventory turn management:
- Cash flow optimization: Faster turns reduce working capital requirements and financing costs
- Obsolescence reduction: High turnover minimizes risks of product depreciation or expiry
- Demand alignment: Reveals whether purchasing strategies match actual market consumption
- Storage cost control: Lower inventory levels directly reduce warehousing expenses
- Supply chain responsiveness: Indicates how quickly operations adapt to demand changes
Technical Analysis & Strategic Impact
The standard formula calculates Inventory Turns by dividing Cost of Goods Sold (COGS) by Average Inventory Value. This ratio reveals operational efficiency across the entire supply chain, from procurement to final sale.
Industry benchmarks vary significantly. Fast-moving consumer goods (FMCG) typically achieve 8-12 turns annually, while machinery or luxury goods may only turn 2-3 times. Understanding your sector’s standards is essential for meaningful interpretation.
Three critical factors influence turnover rates:
Lead time variability: International shipments introduce unpredictability. Ocean freight from Asia to Europe takes 30-45 days, plus customs clearance. Companies must balance safety stock against holding costs.
Seasonality patterns: Fashion, electronics, and agricultural products face dramatic demand fluctuations. Successful importers adjust purchasing cycles to maintain consistent turns throughout the year, avoiding end-of-season markdowns.
Regulatory compliance: Certain products require mandatory quality testing upon arrival. Pharmaceuticals and food items may sit in quarantine for weeks, artificially lowering turnover ratios. The EU Food Safety Regulations mandate specific storage conditions that impact inventory velocity.
At DocShipper, we analyze clients’ historical turnover data to optimize their purchasing calendars. By synchronizing order placement with consumption patterns, we help maintain target turn rates while minimizing stockout risks during customs processing.
Financial implications: Every point of improvement in inventory turns releases significant capital. A company with €500,000 average inventory increasing from 4 to 5 turns annually frees €100,000 for reinvestment or debt reduction.
Advanced practitioners segment turnover analysis by product category, supplier origin, and sales channel. This granular approach identifies underperforming SKUs and guides procurement strategy adjustments with precision.
Calculation Methods & Real-World Scenarios
Understanding the mathematics behind Inventory Turns transforms theoretical knowledge into actionable insights. The primary formula is: Inventory Turns = COGS ÷ Average Inventory. Average inventory is calculated as (Beginning Inventory + Ending Inventory) ÷ 2.
Consider a practical example from international electronics trade:
| Metric | Company A (Optimized) | Company B (Standard) |
|---|---|---|
| Annual COGS | €2,400,000 | €2,400,000 |
| Average Inventory | €300,000 | €600,000 |
| Inventory Turns | 8.0 | 4.0 |
| Days of Inventory | 45 days | 91 days |
| Annual Holding Cost (15%) | €45,000 | €90,000 |
Company A’s superior turnover ratio delivers €45,000 annual savings on holding costs alone. This advantage compounds when considering reduced obsolescence risk and improved cash conversion cycles.
Real-world scenario: A European furniture importer sourcing from Vietnam faced declining turns (from 6 to 3.5 annually). Analysis revealed the problem: bulk ocean freight orders optimized for container economies but ignored demand patterns.
The solution combined three strategies: splitting annual volumes into quarterly shipments, utilizing air freight for best-sellers, and implementing vendor-managed inventory for slow movers. Within 12 months, turns recovered to 5.8, releasing €180,000 in working capital.
Five critical benchmarks for inventory turn optimization:
- FMCG sector: Target 10-15 turns annually; premium on freshness and shelf life management
- Fashion/apparel: Aim for 4-6 turns; seasonal collections require aggressive end-of-cycle clearance
- Industrial equipment: Expect 2-4 turns; high unit values justify lower velocity
- Electronics/tech: Achieve 6-9 turns; rapid obsolescence demands aggressive turnover
- Automotive parts: Maintain 8-12 turns; just-in-time delivery systems drive higher velocity
At DocShipper, we conduct turnover audits for clients entering new markets. Our analysis identifies optimal reorder points based on shipping lead times, customs processing durations, and seasonal demand curves—ensuring inventory efficiency from day one.
Conclusion
Mastering Inventory Turns transforms logistics from a cost center into a strategic profit driver. Companies that optimize this metric consistently outperform competitors on cash flow, profitability, and market responsiveness.
Need expert guidance on inventory optimization for your international supply chain? Contact DocShipper for a customized logistics strategy that maximizes your turnover efficiency.
📚 Quiz
Test Your Knowledge: Inventory Turns
What does Inventory Turns fundamentally measure?
A company has €2,400,000 annual COGS and €300,000 average inventory. Their inventory turns are 8.0. Is this ratio universally considered "excellent" across all industries?
Your electronics importer wants to improve inventory turns. Which approach aligns with best practices?
🎯 Your Result
📞 Free Quote in 24hFAQ | Inventory Turns: Definition, Calculation & Practical Examples
There's no universal benchmark—it varies by industry. FMCG companies should target 10+ turns annually, while luxury goods or heavy machinery may only achieve 2-4 turns. Compare your performance against direct competitors rather than cross-industry averages. Context matters: a manufacturer with 8 turns might be efficient, while a retailer with the same ratio could be underperforming.
Extended lead times from Asia or Latin America force companies to maintain higher safety stock, naturally reducing turnover ratios. Smart importers compensate by splitting orders across multiple shipment methods (ocean for base stock, air freight for replenishment), using bonded warehouses closer to end markets, or negotiating consignment arrangements with suppliers to keep inventory off their balance sheets until sale.
Yes—excessively high turnover may indicate chronic stockouts, rushed purchasing at premium prices, or inadequate safety stock for demand spikes. Ratios above industry norms by 50% or more warrant investigation. The goal is optimization, not maximization. Balance working capital efficiency against service level requirements and customer satisfaction metrics.
For new products without historical COGS data, use projected monthly sales multiplied by cost per unit. If you expect to sell 500 units monthly at €20 cost, your annual COGS projection is €120,000. Divide by your planned average inventory investment (e.g., €30,000 for 1,500 units buffer) to estimate 4 turns annually. Revise quarterly as actual sales data accumulates.
These metrics are inverse expressions of the same concept. DSI = 365 ÷ Inventory Turns. If your turnover ratio is 6, your DSI is approximately 61 days. Some industries prefer DSI because it directly shows how long capital is tied up in stock. Use whichever format resonates better with your stakeholders—they convey identical information.
Goods stuck in customs still count as inventory on your balance sheet, artificially lowering your turnover ratio. To analyze operational efficiency accurately, some companies calculate "available inventory turns" excluding in-transit or customs-held stock. This provides clearer insight into warehouse management effectiveness separate from border processing issues beyond your control.
Always use COGS (Cost of Goods Sold) for accurate comparison. Using sales revenue inflates the ratio by including your markup, making cross-company comparisons meaningless. COGS reflects the actual capital tied up in inventory. Some quick analyses use revenue for simplicity, but this introduces distortion—especially when comparing businesses with different margin structures.
Calculate monthly for trending analysis and quarterly for strategic decision-making. Annual calculations miss seasonal patterns and delayed reaction to problems. Rolling 12-month calculations smooth out seasonality while maintaining responsiveness. High-velocity businesses may benefit from weekly calculations for specific product categories, especially during promotional periods or market disruptions.
These terms are interchangeable—both describe the same metric. "Inventory Turnover Ratio" is the formal accounting term, while "Inventory Turns" is industry shorthand. Some regions prefer one over the other (UK tends toward "stock turn"), but the calculation and interpretation remain identical. Focus on consistency within your organization rather than terminology debates.
Seasonal businesses experience dramatic turnover fluctuations—holiday retailers might see 15 turns in Q4 but only 2 in Q1. Use rolling annual averages to assess performance fairly. Strategic approaches include diversifying product lines to balance seasonal peaks, pre-positioning inventory in bonded warehouses, or leveraging drop-shipping for off-season sales to minimize physical inventory during slow periods.
Aggressive turnover improvement without considering service levels can backfire. Reducing inventory too much causes stockouts, customer dissatisfaction, and lost sales. The optimal strategy balances carrying costs against lost opportunity costs. Before slashing inventory, analyze your order fill rate, backorder frequency, and customer retention metrics. Sustainable improvement comes from demand forecasting accuracy and supply chain responsiveness, not just inventory reduction.
DocShipper provides end-to-end visibility into your supply chain, enabling precise lead time predictions that reduce safety stock requirements. Our consolidation services allow smaller, more frequent shipments without proportional cost increases—directly improving turnover. We also offer vendor management and quality control at origin, reducing defect-related inventory write-offs. Our clients typically see 15-30% turnover improvements within six months through better shipment timing and reduced customs delays.
Need Help with
Logistics or Sourcing ?
First, we secure the right products from the right suppliers at the right price by managing the sourcing process from start to finish. Then, we simplify your shipping experience - from pickup to final delivery - ensuring any product, anywhere, is delivered at highly competitive prices.


Fill the Form
Prefer email? Send us your inquiry, and we’ll get back to you as soon as possible.
Contact us 

