In short ⚡
Base Stock Level is the minimum inventory quantity a company maintains to ensure continuous operations and meet customer demand without stockouts. This critical inventory parameter acts as a safety buffer, accounting for lead time variability and demand fluctuations in supply chain management.
Introduction
Many businesses struggle with the delicate balance between overstocking and stockouts. Setting an appropriate Base Stock Level addresses this challenge by establishing a strategic inventory threshold that protects against supply chain disruptions while minimizing carrying costs.
In international logistics and import/export operations, this concept becomes even more critical. Extended lead times, customs delays, and transportation uncertainties make proper inventory planning essential for business continuity.
- Safety buffer: Protects against demand spikes and supply delays
- Service level optimization: Ensures product availability for customers
- Cost management: Balances holding costs with stockout risks
- Lead time coverage: Accounts for replenishment cycle duration
- Demand variability: Absorbs fluctuations in customer orders
In-Depth Analysis & Expert Insights
The Base Stock Level represents a fundamental inventory policy where stock is replenished to a predetermined level after each demand occurrence. This differs from reorder point systems by maintaining a constant target inventory position rather than triggering orders at specific thresholds.
Calculation methodology typically incorporates several variables: average demand during lead time, safety stock requirements, and service level targets. The formula generally follows: Base Stock Level = (Average Daily Demand × Lead Time) + Safety Stock.
The safety stock component deserves particular attention. It protects against two primary uncertainties: demand variability and supply lead time fluctuations. Statistical methods often use standard deviation calculations to determine appropriate safety stock levels based on desired service levels.
Regulatory compliance in international trade adds complexity. Certain products require minimum stock levels for customs bonded warehouses or regulatory inspections. The World Customs Organization provides guidelines on inventory requirements for various trade facilitation programs.
Dynamic adjustment is crucial for optimal performance. Seasonal demand patterns, promotional activities, and market trends necessitate regular review and modification of base stock levels. At DocShipper, we help clients implement automated systems that adjust these parameters based on real-time demand signals and supply chain conditions.
The cost-service trade-off remains central to base stock optimization. Higher levels improve service but increase holding costs, insurance, and obsolescence risks. Advanced inventory models use economic optimization to balance these competing objectives, considering factors like storage costs, stockout penalties, and capital opportunity costs.
Practical Examples & Data-Driven Scenarios
Understanding base stock levels requires examining real-world applications across different industries and scenarios. The following comparisons illustrate how various factors influence optimal inventory positioning.
| Industry | Average Lead Time | Demand Variability | Base Stock Coverage |
|---|---|---|---|
| Electronics | 45-60 days | High (CV: 0.4-0.6) | 90-120 days |
| Automotive Parts | 30-45 days | Medium (CV: 0.2-0.4) | 60-90 days |
| FMCG | 15-30 days | Low (CV: 0.1-0.2) | 45-60 days |
| Pharmaceuticals | 60-90 days | Low (CV: 0.15-0.25) | 120-150 days |
Use Case: Electronics Importer Optimization
A European electronics distributor imports smartphones from Asia with a 50-day average lead time. Historical data shows average daily demand of 200 units with a standard deviation of 80 units. Targeting a 95% service level (Z-score: 1.65):
- Lead time demand: 200 units/day × 50 days = 10,000 units
- Safety stock calculation: 1.65 × 80 × √50 = 933 units
- Base Stock Level: 10,000 + 933 = 10,933 units
- Inventory investment: At €300/unit = €3,279,900
- Annual holding cost: At 25% carrying cost = €819,975
This calculation demonstrates the financial implications of base stock decisions. DocShipper assists clients in optimizing these parameters by analyzing historical shipment data, supplier reliability metrics, and seasonal demand patterns to minimize total inventory costs while maintaining service commitments.
Key Performance Metrics
- Inventory turnover: Base stock policies typically achieve 6-12 turns annually depending on lead time
- Fill rate impact: Proper base stock levels improve fill rates from 85% to 95%+
- Stockout reduction: Well-calibrated systems reduce stockout incidents by 60-80%
- Working capital efficiency: Optimized levels reduce excess inventory by 20-30%
- Customer satisfaction: Consistent availability increases customer retention by 15-25%
DocShipper Platform
Optimize Your Global Logistics with Cutting-Edge Solutions
Enhance efficiency, cut costs, and gain 24/7 visibility 
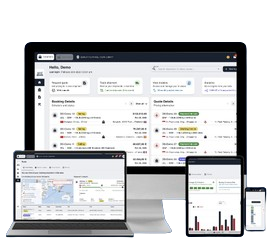
- Cut your shipping costs and maximize your margins
- Manage sourcing, freight, & customs on one platform
- Get real-time tracking and analytics
Conclusion
Establishing optimal Base Stock Levels requires balancing service objectives with inventory costs while accounting for supply chain uncertainties. This strategic parameter directly impacts customer satisfaction, working capital efficiency, and operational resilience in international logistics.
Need expert guidance on inventory optimization for your import/export operations? Contact DocShipper for tailored supply chain solutions that align inventory policies with your business objectives.
📚 Quiz
Test Your Knowledge: Base Stock Level
Q1 — What does the Base Stock Level represent in inventory management?
Q2 — How does a Base Stock Level policy differ from a reorder point system?
Q3 — A European importer has an average daily demand of 200 units, a 50-day lead time, and a safety stock of 933 units. What is the correct Base Stock Level?
🎯 Your Result
📞 Free Quote in 24hFAQ | Base Stock Level: Definition, Calculation & Practical Examples
Base stock level maintains a constant target inventory position, replenishing after each demand. Reorder point triggers orders only when inventory drops to a specific threshold, allowing stock to fluctuate between maximum and minimum levels.
Review quarterly at minimum, with monthly adjustments for high-variability products. Seasonal businesses should reassess before peak periods. Significant demand changes or supply chain disruptions warrant immediate recalculation.
Yes. Excessive levels increase holding costs, obsolescence risk, and capital lock-up. Optimal levels balance service requirements with cost efficiency, typically targeting 95-98% service levels rather than 100%.
Lead time uncertainty requires additional safety stock. Calculate using combined variance of demand and lead time: Safety Stock = Z × √[(Avg LT × Demand Variance) + (Avg Demand² × LT Variance)].
Most businesses target 95-98% service levels. Critical items may justify 99%+, while low-value products might use 90-95%. Higher targets exponentially increase safety stock requirements and costs.
Customs clearance uncertainty extends effective lead time. Add average customs processing time plus buffer for inspections (typically 3-7 days) to supplier lead time when calculating base stock for international shipments.
Absolutely. Each location requires independent calculation based on local demand patterns, replenishment lead times, and service level requirements. Central warehouses typically maintain higher levels than regional facilities.
Essential data includes: 12+ months of demand history, supplier lead time records, demand standard deviation, target service level, unit costs, and holding cost percentage. More data improves accuracy.
Temporary promotions require separate planning. Calculate additional stock based on expected demand lift and event duration, then revert to standard levels post-promotion. Don't incorporate promotional spikes into baseline calculations.
Yes, but with modifications. Shorter shelf life requires balancing service levels against expiration risk. Use shorter planning horizons and implement FIFO rotation strictly. Consider maximum age constraints in safety stock calculations.
Accurate forecasting reduces required safety stock by minimizing demand uncertainty. Improved forecast accuracy from 70% to 85% can reduce safety stock requirements by 30-40% while maintaining service levels.
Use analogous product data, market research, or supplier recommendations. Start with conservative estimates (higher safety factors), then adjust monthly based on actual demand patterns during the first 3-6 months.
Need Help with Logistics or Sourcing ?
First, we secure the right products from the right suppliers at the right price by managing the sourcing process from start to finish. Then, we simplify your shipping experience - from pickup to final delivery - ensuring any product, anywhere, is delivered at highly competitive prices.
Fill the Form
Prefer email? Send us your inquiry, and we’ll get back to you as soon as possible.
Contact us