Introduction
In early 2022, ocean freight rates shattered every record — container prices soared past $20,000 per FEU on Trans-Pacific routes, as port congestion, container shortages, and post-COVID demand surge collided into a perfect storm. Today, the pendulum has swung sharply in the opposite direction.
In 2026, the market is a buyer’s market: massive vessel overcapacity, weakening global demand, and spot rates down over 70% from their peak are redefining the rules of the game. Some lanes have already seen freight costs fall below pre-pandemic levels.
For companies that know how to read market signals and pull the right levers, this correction is a golden opportunity to slash logistics costs and unlock unprecedented margins. This article gives you the keys to understand 2026 shipping dynamics, identify the residual risks that will prevent rates from collapsing entirely, and — most importantly — turn this price drop into a lasting competitive advantage.
BANNIERE BLEUE
Understanding the 2026 Shipping Market Dynamics

The 2026 shipping market is the product of three converging forces: a historic flood of new vessel deliveries, a structural drop in consumer demand, and a global economic slowdown that is reshaping trade flows. Understanding these dynamics is the first step to turning market volatility into a strategic advantage.
The Record-Breaking Vessel Delivery Wave (Oversupply of TEUs)
Between 2020 and 2023, shipping lines placed massive vessel orders to capitalize on sky-high charter rates. This colossal order book — estimated at over 800 container ships representing more than 7 million TEUs of additional capacity — has been delivered between 2024 and 2026. The result is unambiguous: the global fleet now displays unprecedented structural overcapacity not seen since the 2016 crisis.
The supply/demand ratio, which serves as the market’s barometer, now shows a 10%+ capacity surplus on the main East-West routes. In a market as sensitive to supply-demand balance as maritime shipping, even a 5% surplus is enough to drive rates down significantly.

Why the 2026 “Pre-CNY Surge” Failed to Materialize
Typically, the weeks leading up to Chinese New Year (CNY) generate a characteristic demand spike: Asian manufacturers rush shipments before factory closures, and Western importers replenish their inventories. In 2026, this classic pattern simply did not happen.
Three converging factors explain this anomaly:
- First, US and European companies drastically reduced their inventory levels following the overstocking crisis of 2022–2023.
- Second, tariff uncertainty linked to US trade policies pushed many importers into a wait-and-see posture.
- Third, the rise of nearshoring has transferred part of production to geographically closer zones (Mexico, Turkey, Eastern Europe), mechanically reducing volumes on long-haul routes.
Impact of Global Economic Cooling on Container Demand
The International Monetary Fund (IMF) projects global trade growth of only 2.8% in 2026, well below the decade-long average of 4.5%. In the Eurozone, household consumption remains sluggish under the weight of persistent inflation, high interest rates, and deteriorating consumer confidence.
In the United States, while the labor market stays resilient, demand for imported manufactured goods (electronics, textiles, furniture) has declined in favor of services.
This combination — supply glut + demand contraction — creates the ideal conditions for a sustained correction in freight rates.
The Primary Drivers Behind Falling Freight Rates
Freight rates don’t fall by accident — behind every market correction lies a precise set of structural and cyclical triggers. In 2026, three major forces are simultaneously pushing rates downward, creating a window of opportunity that sharp shippers must learn to exploit.
Vessel Overcapacity: Too Many Ships, Not Enough Cargo
Vessel overcapacity is the number-one driver of the current rate decline. With a global fleet that expanded by +28% in capacity between 2021 and 2026, carriers find themselves competing for a cargo pool that has not grown at the same pace. On Asia-Europe routes, vessel utilization rates have dropped below 80% — the threshold below which carriers typically resort to rate discounting to fill their holds.
Concretely, this translates into spot prices on the Shanghai–Rotterdam route that have fallen more than 60% from their 2022 peaks. On the Trans-Pacific (Shanghai–Los Angeles), the trend is similar, with rates currently oscillating between $1,200–$1,800/FEU depending on the week.
Route | 2022 Peak ($/FEU) | 2026 Estimate ($/FEU) | Change |
Shanghai → Rotterdam | ~$14,000 | ~$1,500 – $2,200 | ▼ -84% |
Shanghai → Los Angeles | ~$12,000 | ~$1,200 – $1,800 | ▼ -85% |
Shanghai → Felixstowe | ~$16,000 | ~$1,600 – $2,400 | ▼ -86% |
Intra-Asia | ~$3,000 | ~$500 – $800 | ▼ -75% |
Weakening Consumer Demand in EU and US Markets
Western economies are going through a period of reduced appetite for imported goods. In Europe, the shift toward greater frugality and circular economy principles, combined with persistent services inflation (energy, housing, food), shrinks the disposable income available for consumer goods. According to Eurostat, household consumption of manufactured goods in the EU fell by 3.2% in 2024, with Germany and France leading the decline at -4.1% and -3.7% respectively. Consumer confidence in the Eurozone remained in negative territory throughout 2024, averaging -12.4 points on the European Commission index — a clear signal that Europeans are buying less and saving more.
In the United States, the “Buy American” trend and the growing popularity of direct-to-consumer platforms like Temu or Shein — which ship via air express, bypassing traditional logistics chains — are reducing containerized volumes. The US Census Bureau reported that retail goods imports dropped 6.8% in volume terms in 2024 compared to their 2022 peak. Meanwhile, cross-border e-commerce parcel shipments (primarily from China via air) surged to over 1 billion packages/year entering the US — cargo that bypasses ocean containers entirely. The result: fewer full containers booked, more empty slots on trans-Pacific vessels, and further downward pressure on container shipping rates.
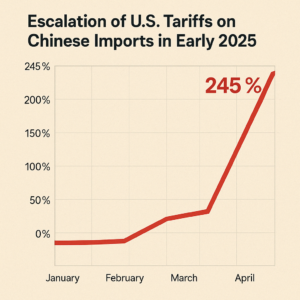
The “Trade Truce” Effect: Why Geopolitical Stability Lowers Premiums
Paradoxically, a relative geopolitical calm can contribute to lower freight rates. The term “Trade Truce” refers to the partial de-escalation of trade tensions between major economic blocs — most notably the US–China relationship, which after years of tariff escalation entered a phase of cautious diplomatic engagement in late 2024 and early 2025. Under this truce, both sides agreed to pause the introduction of new tariff layers on specific product categories, reducing the urgency for importers to rush shipments ahead of new barriers. Similarly, the gradual cooling of the US–EU trade dispute over steel and aluminum tariffs, and the relative stabilization of the Russia-Ukraine conflict’s impact on European logistics corridors, removed several layers of premium pricing that had artificially inflated freight costs.
The concrete logistics impact is significant. During periods of tension (such as the Red Sea attacks in 2023–2024, which forced vessels to reroute via the Cape of Good Hope, adding 10–14 days and $1,000–$2,000/FEU in extra costs), risk premiums and War Risk Surcharges (WRS) could represent $500 to $1,500 per container. A relative normalization of maritime routes — even partial — eliminates these surcharges and returns vessels to shorter, more efficient itineraries. According to BIMCO, the return of vessels to the Suez Canal route alone freed up the equivalent of ~3% of global effective capacity — adding further downward pressure on already-soft rates in 2026.
BANNIERE ROUGE
The “Floor” Factor: Why Rates Won’t Hit Zero
The EU ETS Carbon Tax Expansion and IMO 2026 Compliance
Since January 2024, carriers operating on routes touching European ports have been subject to the EU Emissions Trading System (EU ETS). In 2026, the scope expands further: 100% of emissions from intra-European voyages and 50% of emissions from extra-European voyages are covered.
On top of this, the new IMO 2026 regulations (CII — Carbon Intensity Indicator) impose speed reductions or investments in alternative fuels (methanol, ammonia, LNG) for the least-performing vessels.
In practical terms, these “green” surcharges represent an average of $150 to $400 per container depending on the route, creating a structural floor below which rates cannot fall without pushing carriers into operational deficit.
Carrier “Blank Sailings” as a Desperate Price-Support Tactic
Faced with collapsing rates, major shipping alliances (such as 2M, Ocean Alliance, and THE Alliance) resort to blank sailings — the planned cancellation of scheduled services — to reduce available capacity and artificially rebalance the market.
In 2026, this mechanism is hitting its limits: too many cancellations undermine service reliability and push shippers toward competitor alliances. Blank sailings therefore create a floor, but a fragile one.

Labor Union Tensions and Port Infrastructure Bottlenecks
North American ports (Long Beach, New York/New Jersey) and several European ports (Antwerp, Rotterdam) are facing tense union negotiations in 2026.
Any labor action can instantly create multi-week backlogs, send rates spiking again, and turn a soft-market opportunity into an operational nightmare. Supply chain resilience therefore remains imperative even in a buyer’s market.
Strategic Timing: When to Lock in Your 2026 Contracts
In a falling market, timing is everything — signing at the wrong moment can lock you into rates that are 30 to 50% above what the market will offer just weeks later. Here is a quarter-by-quarter breakdown of the best windows to negotiate, renegotiate, and lock in your 2026 freight contracts.
Q1 2026: Post-CNY Market Crash Opportunities
The weeks immediately following Chinese New Year historically represent the annual cycle’s lowest point. Factories reopen gradually, volumes are thin, and carriers are desperate to fill their vessels at almost any price. This is the best window to negotiate spot contracts or short-term deals of 1 to 3 months at highly favorable rates. The Drewry WCI and Xeneta indices typically show their annual low between mid-February and end of March.
Q2 2026: The Window for Annual Contract Negotiations
The second quarter is the traditional renegotiation period for annual freight contracts (Service Contracts). This is the window where shippers hold the most negotiating leverage, as carriers are eager to secure their order book before peak season. Use this period to benchmark your current rates against the market (Xeneta, Drewry, Freightos Baltic Index) and aggressively renegotiate your capacity allocations.
Q3/Q4 2026: Anticipating “Green Regulation” Surcharges
The second half of 2026 will be marked by the enforcement of new environmental regulations. Carriers will begin building IMO 2026 surcharges into their pricing. Locking in long-term contracts before September 2026 can save you hundreds of dollars per container on impacted routes — making proactive contract timing a key profit lever this year.
BANNIERE VERTE
Proactive Strategies to Leverage Lower Rates
Knowing that rates are falling is not enough — the real competitive edge lies in how fast and how smartly you act. The following three strategies, illustrated with concrete real-world cases, show exactly how forward-thinking shippers are already turning the 2026 soft market into measurable cost savings.
Shifting from Long-Term Contracts to the Spot Market

Concrete case: A French electronics importer from Shenzhen had signed a 2023 annual contract at $3,200/FEU on the China–Le Havre route, locking in security after the capacity shortages of that year.
In 2026, spot rates on the same route are oscillating between $1,400 and $1,900/FEU. By gradually migrating 60% of its volumes to the spot market (while keeping 40% on contract for planning stability), the company saves an average of $1,100/FEU — equivalent to over €180,000/year on 165 containers annually. The key? Weekly monitoring of the Xeneta index and a trusted freight forwarder relationship to act quickly when windows open.
Consolidating Shipments to Maximize Vessel Overcapacity
Concrete case: A Belgian furniture importer shipping LCL (groupage) decided to accumulate orders over 3-week cycles instead of 10 days, transitioning from fragmented LCL loads to full FCL containers. By leveraging excess vessel capacity, they negotiated FCL 40′ rates at $1,600/FEU vs. $2,200 in LCL equivalent — a 27% cost reduction while also simplifying customs clearance and reducing transit variability.
Using Real-Time Data to Outmaneuver Carrier Pricing
Freight intelligence platforms like Xeneta, Freightos, or Flexport now allow shippers to track spot rates in near-real-time and identify pricing windows. A German e-commerce company set up automated alerts: whenever the Drewry WCI on its primary route drops below a defined threshold, it automatically triggers additional bookings to replenish inventory at the lowest cost. Result: a 22% reduction in average annual freight cost with no sacrifice in product availability.
BANNIERE VERTE
2026 Tariffs vs. Freight Rates: The Balancing Act
Lower freight rates are great news — but they tell only half the story. In 2026, rising customs tariffs on Chinese-origin goods are quietly eroding the savings shippers expect to pocket, turning what looks like a cost-reduction opportunity into a complex financial balancing act that demands careful product-by-product analysis.
How 2026 Tariff Hikes Offset Shipping Savings
DocShipper Platform
Cut logistics costs. Not corners.
See exactly where your logistics costs are bleeding — and how to fix it. Book your expert demo.

Falling ocean freight rates do not automatically translate into lower total import costs. New tariff measures (customs duties) introduced by the US, the European Union, and other economic blocs in 2025–2026 can neutralize — or even exceed — the savings made on transportation. On certain Chinese-origin goods hit by additional duties of 25% to 145%, a $1,500/FEU saving on freight remains negligible compared to the tariff impact on cargo value.
Front-Loading Inventory Before New Trade Barriers
The front-loading strategy consists of importing heavily before new tariff measures take effect. This tactic, widely used in 2018 and again in 2024, has its limits: it ties up capital in stock, generates warehousing costs, and exposes businesses to obsolescence risk.
For 2026, the most prudent approach is to front-load only high-turnover, high-margin products, in coordination with your supply chain team and a careful cash-flow analysis.
Geographic Diversification: Shipping from Non-Tariff Zones
A growing number of companies are relocating part of their sourcing to countries less exposed to punitive tariffs: Vietnam, India, Bangladesh, Morocco for textiles; Mexico for electronics components and automotive thanks to USMCA.
While this diversification requires an upfront investment in supplier auditing and quality control, the medium-term savings — both on freight and customs duties — can be substantial.
Complete Checklist: Your 2026 Freight Savings Plan
In a volatile market, discipline beats instinct. This checklist gives you a structured, time-based action plan to stay ahead of rate movements, benchmark your costs, and renegotiate with confidence — month after month, quarter after quarter, throughout 2026.
Monthly: Reviewing Freight Rate Indices (Xeneta / Drewry)
The monthly review is your early warning system. Freight rates can shift by 10–20% within a single week — tracking the right indices every month ensures you never miss a window to book cheaper or renegotiate your existing rates before the market moves against you.
- Check the Drewry World Container Index (WCI) every week
- Cross-reference with the Freightos Baltic Index (FBX) and Xeneta data
- Set up price alerts on your top 3 key routes
- Share market data with your procurement and supply chain teams
Quarterly: Benchmarking Your Rates Against the Market Average
The quarterly benchmark is your reality check. It’s the moment to step back, compare what you’re actually paying against what the market offers, and identify whether your current carrier mix and contract structure still make sense — or whether it’s time to renegotiate aggressively.
- Analyze the gap between your contracted rates and current spot rates
- Request counter-offers from at least 3 carriers or freight forwarders
- Evaluate opportunities to migrate volumes from contract to spot (or vice versa)
- Review applied surcharges (BAF, ETS, THC) and compare them to the market
2026 Perspectives and Emerging Trends
Beyond the immediate rate cycle, three structural shifts are permanently reshaping global shipping — from the rise of green maritime corridors and port automation to the radical redrawing of supply chain geographies. Shippers who anticipate these trends today will hold a decisive competitive advantage tomorrow.
The Shift Toward “Green Shipping” Corridors
The Green Shipping Corridors initiative — dedicated maritime routes for low-emission vessels — is progressively materializing. The Singapore–Rotterdam, Shanghai–Los Angeles, and Shanghai–Antwerp corridors are top priorities. For shippers, routing through green corridors often implies slight surcharges on the base freight, but can represent a commercial competitive advantage (ESG reporting, regulatory compliance, sustainability-driven tenders).
Automation in Port Handling Reducing Operational Delays
The automation of container terminals (Rotterdam Maasvlakte II, Qingdao, Guangzhou Nansha) is starting to produce measurable gains in port productivity. Average handling times have dropped by 15 to 20% at the most advanced terminals. For shippers, this translates into fewer transit time uncertainties and better delivery reliability — an increasingly important differentiator in competitive tenders.
Nearshoring vs. Long-Haul: The Changing Map of Global Trade
Nearshoring is no longer a trend — it’s a structural reality. Mexico has become the United States’ top trading partner, surpassing China. India is asserting itself as an alternative manufacturing hub in electronics and pharma. In Europe, Morocco, Turkey, and Poland are capturing growing industrial investment flows. This geographical reshaping of supply chains is profoundly altering containerized trade flows: less long-haul Asia–West, more high-value regional flows.