


In short ⚡
Liquefied Natural Gas (LNG) is natural gas cooled to -162°C (-260°F), transforming it into a clear, non-toxic liquid that occupies 600 times less volume than its gaseous state. This liquefaction process enables economical intercontinental transportation via specialized cryogenic tankers, making LNG a critical component of global energy trade and a key transition fuel in decarbonization strategies.Introduction
The global energy landscape faces a persistent challenge: how to transport natural gas from production sites to consumption markets separated by oceans. Traditional pipelines become economically unviable beyond certain distances, creating supply bottlenecks for energy-hungry regions.
LNG emerged as the transformative solution to this geographical constraint. By liquefying natural gas through cryogenic cooling, energy companies unlock the ability to transport massive volumes across continents using specialized maritime vessels.
Understanding LNG logistics is essential for:
- Energy importers diversifying supply sources beyond pipeline dependencies
- Shipping operators investing in highly specialized, capital-intensive carrier fleets
- Port authorities developing regasification infrastructure to reconvert LNG to usable gas
- Freight forwarders coordinating complex multi-modal energy supply chains
- Compliance teams navigating stringent IMO safety regulations for hazardous cargo
The LNG trade represents one of the most technically demanding segments of international shipping. DocShipper monitors this sector closely, providing strategic guidance for clients navigating energy commodity logistics.
Technical & Logistics Framework
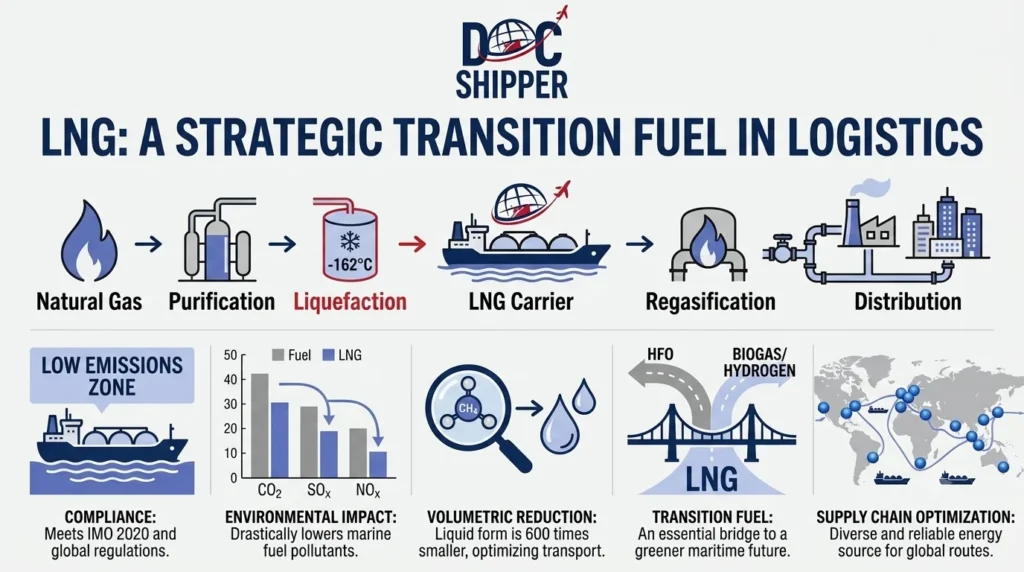
The liquefaction process involves cooling purified natural gas to its condensation point through multiple refrigeration cycles. This transformation reduces volume by approximately 600 times, making intercontinental shipping economically viable where pipelines cannot reach.
LNG carriers represent the pinnacle of maritime engineering. These vessels feature double-hulled cryogenic tanks designed to maintain cargo at -162°C throughout voyages lasting 20-30 days. Modern Q-Flex and Q-Max carriers transport 210,000 to 266,000 cubic meters per voyage, equivalent to 140-180 million cubic meters of natural gas in gaseous form.
The supply chain architecture requires three critical infrastructure components. Liquefaction terminals at export locations compress and cool the gas. Specialized LNG carriers maintain cryogenic temperatures during transit. Regasification terminals at import destinations reconvert the liquid back to gas for pipeline distribution to end users.
Boil-off gas management presents a unique logistics challenge. Even with advanced insulation, approximately 0.10-0.15% of cargo evaporates daily during transport. Modern carriers capture this boil-off, using it as supplementary fuel for propulsion, improving voyage economics while reducing emissions.
Regulatory compliance is governed by the IMO International Code for the Construction and Equipment of Ships Carrying Liquefied Gases in Bulk (IGC Code). This framework mandates vessel design standards, crew training certifications, and operational protocols specific to cryogenic cargo handling.
At DocShipper, we coordinate with specialized LNG brokers and terminal operators to ensure our clients’ energy shipments comply with all safety protocols and arrive on schedule, avoiding costly demurrage charges at regasification facilities.
Shipping Examples & Market Data
Global LNG trade volumes reached 542 million tonnes in 2023, with maritime transport accounting for virtually all intercontinental movements. Major export routes connect Qatar, Australia, and the United States to demand centers in Asia and Europe.
Case Study: Qatar to South Korea Route
A Q-Max carrier departs Ras Laffan with 266,000 m³ of LNG. The 6,200 nautical mile voyage to Incheon takes 18 days at 19.5 knots. Daily boil-off of 0.12% generates approximately 320 m³ of natural gas, which powers auxiliary engines. Freight costs average $45,000-$65,000 per day depending on charter market conditions. Total voyage cost approaches $1.1 million, translating to approximately $0.60 per MMBtu for transportation alone.
The following table compares key LNG carrier classes by capacity and operational characteristics:
| Vessel Class | Capacity (m³) | Typical Route | Daily Charter Rate | Boil-off Rate |
|---|---|---|---|---|
| Conventional | 125,000-150,000 | Regional trades | $35,000-$50,000 | 0.15%/day |
| Q-Flex | 210,000-216,000 | Middle East to Asia | $50,000-$70,000 | 0.12%/day |
| Q-Max | 260,000-266,000 | Qatar to Asia/Europe | $60,000-$85,000 | 0.10%/day |
| Small-Scale | 10,000-30,000 | Coastal/bunkering | $15,000-$25,000 | 0.20%/day |
Market dynamics: The 2022 European energy crisis triggered unprecedented spot charter rates, with some short-term contracts exceeding $350,000 per day as buyers scrambled for tonnage. By mid-2023, rates normalized to $70,000-$90,000 for modern tonnage, though remaining elevated compared to historical averages of $40,000-$50,000.
Emerging trade patterns show the United States becoming a dominant exporter. U.S. LNG exports grew from virtually zero in 2016 to over 86 million tonnes in 2023, with new liquefaction capacity along the Gulf Coast reshaping Atlantic Basin trade flows.
For clients considering long-term LNG procurement contracts, DocShipper provides market intelligence on freight rate trends, vessel availability, and optimal loading/discharge port pairs to minimize total delivered costs.
Conclusion
LNG transportation represents the critical enabler of global natural gas trade, connecting stranded reserves with demand centers through sophisticated cryogenic logistics. Mastering the technical, regulatory, and commercial aspects of this supply chain is essential for energy security and competitive procurement strategies.
Need expert guidance on LNG logistics, terminal coordination, or energy commodity shipping? Contact DocShipper’s specialized team for strategic support tailored to your energy supply chain requirements.
📚 Quiz
Test Your Knowledge: LNG (Liquefied Natural Gas)
What is the primary purpose of liquefying natural gas for international shipping?
Boil-off gas during LNG carrier voyages represents:
A freight forwarder coordinating a Qatar-to-Japan LNG shipment on a Q-Max carrier should primarily focus on:
🎯 Your Results
📞 Free Customized QuoteFAQ | LNG (Liquefied Natural Gas): Definition, Transportation & Shipping Examples
LNG (Liquefied Natural Gas) is methane cooled to -162°C, while LPG (Liquefied Petroleum Gas) comprises propane and butane cooled to -42°C. LNG requires cryogenic carriers with specialized insulation, whereas LPG uses pressurized or refrigerated vessels. LNG is primarily used for power generation and heating, while LPG serves residential, industrial, and petrochemical applications. The transportation infrastructure and vessel types are completely different.
Modern LNG carriers can store cargo indefinitely if boil-off gas is continuously managed. With a typical boil-off rate of 0.10-0.15% daily, a fully loaded Q-Max could theoretically maintain cargo for 600-1,000 days before complete evaporation. However, commercial voyages typically last 15-30 days, and carriers return to loading ports rather than remaining at sea. Shore-based storage tanks at terminals can hold LNG for months with proper refrigeration systems.
LNG carriers must comply with the IMO IGC Code, mandating double-hull construction, nitrogen inerting systems to prevent oxygen ingress, emergency shutdown systems, and gas detection throughout cargo areas. Crew members require specialized STCW training for gas carrier operations. Loading/discharge operations follow strict protocols including pre-cooling sequences, vapor return systems, and continuous monitoring of tank pressures and temperatures. Port authorities enforce restricted navigation zones during cargo operations.
As of 2024, Japan leads with regasification capacity exceeding 200 million tonnes per annum across multiple terminals, including Futtsu, Sodegaura, and Chita. Europe's largest facilities include Gate Terminal (Rotterdam, 16 mtpa) and South Hook (UK, 21 mtpa). In the United States, Everett (Massachusetts), Cove Point (Maryland), and Sabine Pass (Louisiana) serve both import and export functions. China is rapidly expanding capacity with new terminals in Jiangsu, Guangdong, and Zhejiang provinces.
LNG pricing follows three main models: oil-indexed contracts (traditional in Asia, linking to crude oil or JCC), hub-based pricing (emerging in Europe and North America, tied to TTF or Henry Hub), and hybrid formulas. Long-term contracts (10-25 years) typically include take-or-pay clauses and destination restrictions. Spot and short-term markets provide flexibility but expose buyers to price volatility. Freight costs are separately negotiated as either DES (seller arranges shipping) or FOB (buyer arranges).
Essential documents include: Bill of Lading (B/L) specifying cargo quantity and quality, Commercial Invoice, Certificate of Origin, Cargo Manifest detailing LNG specifications (heating value, sulfur content), Ship's Certificate of Registry, IGC Code compliance certificates, and crew competency documentation. Import nations require customs declarations, safety data sheets (SDS), and terminal operator acceptance certificates. Some jurisdictions mandate pre-arrival notifications 72-96 hours before berthing at regasification terminals.
LNG carriers routinely transit the Suez Canal, which accommodates vessels up to 20.1-meter draft (suitable for Q-Max carriers). However, the Panama Canal's Neopanamax locks (51.25-meter beam, 15.2-meter draft) cannot accommodate Q-Flex or Q-Max carriers, which exceed these dimensions. Smaller conventional LNG carriers (up to 145,000 m³) may transit Panama if within dimensional limits. Most Asia-Europe LNG trade routes via Suez; Americas-Asia routes must choose between Panama (if size-appropriate) or rounding Cape Horn.
LNG maritime transport emits approximately 20-30 kg CO₂ per tonne of LNG for a 6,000 nautical mile voyage, including liquefaction energy. Pipeline transport over equivalent distances emits 15-25 kg CO₂ per tonne through compressor station electricity consumption. However, LNG offers flexibility for renewable integration at destination terminals and enables methane slip reduction through modern dual-fuel engines. Life-cycle emissions depend heavily on upstream production methods (conventional vs. associated vs. shale gas) and methane leakage rates during extraction and processing.
LNG charter rates reflect vessel supply-demand balance, voyage duration, seasonal demand patterns (winter heating peaks), fuel costs, and cargo volume. Rates are quoted as $/day (time charter) or $/tonne (spot voyages). Modern tonnage commands premiums due to improved fuel efficiency and lower boil-off rates. Major indices include Spark30 Route (USGC to Northwest Europe) and Spark25 Route (USGC to Northeast Asia). Long-term charters (5-25 years) provide rate stability; spot markets offer flexibility with higher volatility.
Recent advancements include: membrane containment systems reducing boil-off to 0.08% daily, slow-speed dual-fuel engines achieving 50+ thermal efficiency, air lubrication systems cutting hull friction by 5-10%, and reliquefaction plants onboard converting boil-off gas back to LNG for zero cargo loss. Shaft generators harness propulsion power for auxiliary systems. Partially loaded voyage optimization software minimizes sloshing risks while improving fuel consumption. Next-generation vessels target 40% emission reductions through ammonia or hydrogen co-firing capabilities.
Geopolitical tensions significantly impact LNG trade patterns. The 2022 Ukraine crisis redirected European demand from Russian pipeline gas to LNG imports, straining global carrier availability and tripling spot charter rates. Strait of Hormuz tensions (handling 30% of global LNG) necessitate insurance war risk premiums and route diversification. Red Sea instability forces longer Cape of Good Hope routing, adding 10-14 days and increasing freight costs by $15-$20 million per voyage. Sanctions regimes create complex compliance requirements for vessel owners serving multiple markets.
Common delay factors include: terminal berth congestion (especially during peak demand seasons), weather constraints preventing safe loading/discharge operations, cargo quality disputes requiring resampling, technical issues with ship-to-shore transfer systems, and regulatory inspections. Demurrage typically accrues at $30,000-$75,000 per day beyond agreed laytime (usually 36-48 hours per operation). Force majeure clauses cover extreme weather, but routine delays are commercial risks. Buyers often negotiate laytime flexibility in take-or-pay contracts to avoid penalties.
Need Help with
Logistics or Sourcing ?
First, we secure the right products from the right suppliers at the right price by managing the sourcing process from start to finish. Then, we simplify your shipping experience - from pickup to final delivery - ensuring any product, anywhere, is delivered at highly competitive prices.


Fill the Form
Prefer email? Send us your inquiry, and we’ll get back to you as soon as possible.
Contact us

:%20Definition,%20Transportation%20&%20Shipping%20Examples)