
In short ⚡
Field Service Parts are spare components, consumables, and replacement items maintained and deployed by service technicians to perform equipment repairs, maintenance, and installations at customer locations. These parts enable immediate intervention without return-to-base delays, optimizing uptime and service-level agreement compliance across industrial, healthcare, and technology sectors.Introduction
A malfunctioning production line can cost manufacturers $22,000 per minute in lost revenue. Yet many organizations struggle with field service parts availability—technicians arrive on-site without the correct component, triggering repeat visits and customer dissatisfaction.
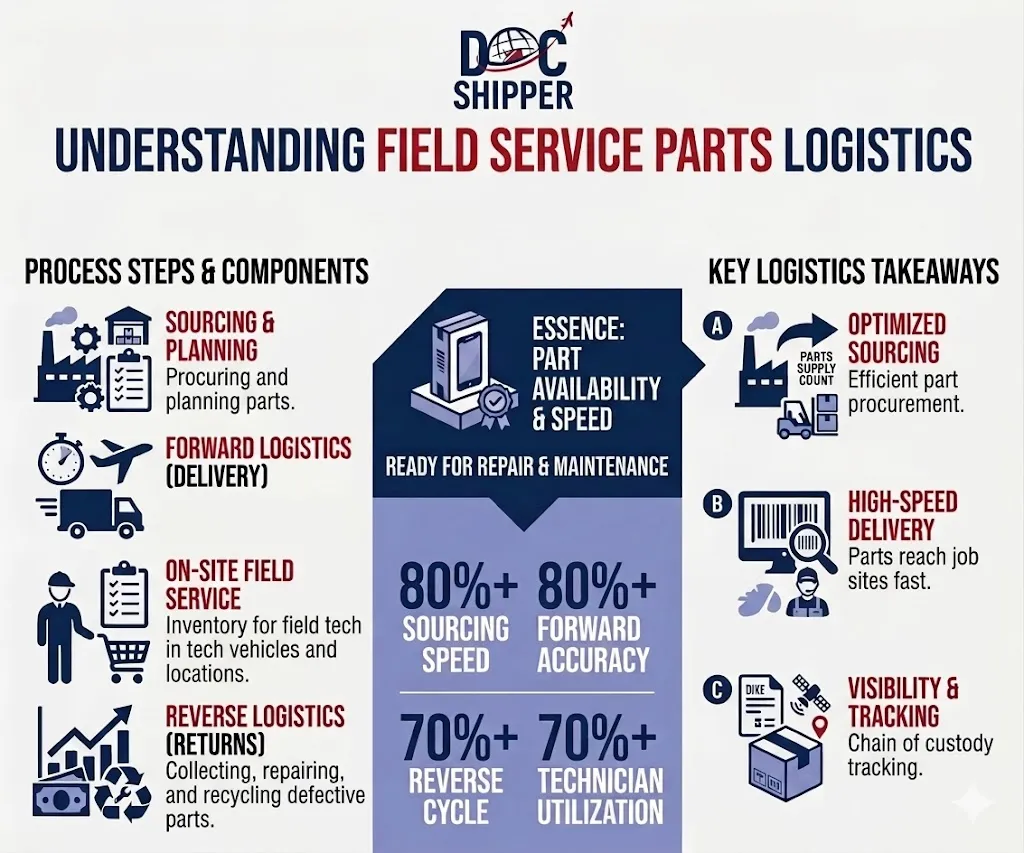
Field service parts logistics addresses this challenge by ensuring the right inventory reaches the right location at the right time. Unlike warehouse-based spare parts, these components travel with mobile technicians or sit in strategically positioned stock points.
Key characteristics include:
- Mobility-focused distribution through van stock, technician kits, or forward stocking locations
- Time-critical availability tied to contractual response times and SLA penalties
- High-value density with items ranging from $5 fasteners to $50,000 circuit boards
- Reverse logistics complexity for defective returns, warranty claims, and repairable exchanges
- Regulatory traceability especially for aviation, medical devices, and defense applications
In-Depth Analysis & Management Strategies
Effective field service parts management operates across three dimensions: inventory optimization, logistics orchestration, and compliance tracking. Each dimension presents distinct operational challenges.
Inventory positioning strategy determines where parts reside within the service network. Organizations choose between centralized distribution centers, decentralized forward stocking locations, or technician trunk stock. Research from the European Parliament on goods movement shows optimal positioning reduces emergency shipment costs by 35-60%.
The stock-keeping unit complexity challenge stems from equipment diversity. A medical device manufacturer may support 200+ product models across 15 years of field installations, translating to 8,000+ unique part numbers. Demand forecasting becomes statistical guesswork—some parts never fail, while others exceed projections by 300%.
Transportation mode selection balances speed against cost. Standard replenishment uses ground freight with 2-5 day transit. Critical failures trigger expedited options: same-day courier for metropolitan areas, air freight for remote installations, or chartered delivery for production-critical situations costing $1,500-$5,000 per emergency shipment.
Reverse logistics integration handles defective returns through warranty claim processes. Aviation and medical sectors require serial number traceability from installation through failure analysis. Parts often move through inspection, refurbishment, or scrap disposition pathways, each with customs and regulatory implications.
Customs considerations affect international service operations. Temporary import permits enable cross-border repairs without permanent importation. Carnet systems facilitate equipment demonstrations. However, documentation errors cause 18-25% of cross-border service delays. At DocShipper, we manage ATA Carnet applications and temporary import documentation to ensure field technicians clear customs without service-level breaches.
Practical Examples & Data
Understanding field service parts logistics requires examining real-world scenarios across industries. The following cases illustrate inventory strategies, cost implications, and operational trade-offs.
Comparative Inventory Positioning Models
| Model | Inventory Investment | First-Time Fix Rate | Best Application |
|---|---|---|---|
| Centralized DC Only | Baseline (100%) | 62-68% | Low service frequency, predictable failures |
| Regional Forward Stocking | +45-65% | 78-84% | Geographic concentration, 4-hour SLAs |
| Technician Trunk Stock | +85-120% | 88-93% | High-frequency consumables, urban density |
| Hybrid Multi-Echelon | +110-150% | 91-96% | Premium service contracts, penalty clauses |
Use Case: Medical Imaging Equipment Service
A diagnostic imaging company maintains 450 MRI and CT systems across Western Europe with contractual 4-hour response commitments. Their parts strategy includes:
- Central European hub in Frankfurt stocks 3,200 SKUs including high-value components (detector arrays, RF coils)
- 12 regional depots carry fast-moving items: cooling system parts, power supplies, patient positioning accessories
- Technician kits contain 80 consumables per van: cables, filters, calibration tools
- Emergency logistics utilize contracted couriers with 2-hour delivery windows for metropolitan areas
- Customs clearance pre-arranged through DocShipper for cross-border emergency shipments between EU and UK facilities
This structure achieves 92% first-time fix rates while limiting obsolescence exposure. Total inventory investment equals $4.2M against $180M annual service revenue—a 2.3% ratio considered optimal for capital-intensive field service operations.
Five Critical Performance Metrics
- Fill Rate — Percentage of service orders fulfilled from available stock (target: 90-95%)
- Inventory Turns — Annual usage divided by average stock value (benchmark: 2.5-4.5x depending on industry)
- Obsolescence Rate — Percentage of inventory written off due to product discontinuation (acceptable: <3% annually)
- Emergency Freight Cost — Expedited shipping as percentage of total logistics spend (control threshold: <8%)
- Return Processing Time — Days from field removal to disposition decision (target: 5-10 business days for warranty validation)
Conclusion
Field service parts logistics directly impacts customer satisfaction, operational efficiency, and contract profitability. Strategic inventory positioning, integrated reverse flows, and customs compliance separate reactive service organizations from proactive leaders.
Need expert guidance on optimizing your field service parts supply chain or navigating international service logistics? Contact DocShipper for customized solutions.
📚 Quiz
Test Your Knowledge: Field Service Parts
What is the primary defining characteristic of field service parts compared to warehouse spare parts?
A service manager claims that centralizing all field service parts in one distribution center maximizes first-time fix rates. Is this correct?
Your medical device technician needs to ship a defective CT scanner component from France to the UK repair depot within 4 hours to meet SLA requirements. Which logistics consideration is MOST critical?
🎯 Your Results
📞 Free Quote in 24hFAQ | Field Service Parts: Definition, Management & Practical Examples
Field service parts are specifically allocated for mobile technician use or forward-positioned locations to enable on-site repairs. Warehouse spare parts remain in centralized storage awaiting allocation. Field parts emphasize availability and mobility, while warehouse parts prioritize inventory consolidation and cost efficiency. The distinction affects stocking strategies, replenishment frequency, and tracking systems.
Organizations analyze failure rate data, service call histories, and part usage patterns through Pareto analysis. Typically, 20% of part numbers represent 80% of usage volume. High-frequency, low-value items with short lead times become trunk stock candidates. Weight, size, shelf life, and theft risk also influence decisions. Advanced systems use machine learning to predict optimal van loads based on scheduled appointments and equipment profiles.
Cross-border field service involves temporary imports, warranty returns, and expedited clearances. Technicians require proper documentation: commercial invoices, certificates of origin, and equipment serial numbers. Many countries offer temporary import relief programs like ATA Carnets. Failure to comply causes border delays averaging 24-72 hours, breaching service-level agreements. Specialized customs brokers pre-clear documentation and maintain bonded courier accounts for time-critical movements.
Technicians remove failed components, document serial numbers, and package items according to hazardous material regulations if applicable. Parts return through regional collection points or direct shipment to repair depots. Triage teams inspect items for warranty eligibility, determine root cause, and route to refurbishment or scrap. Advanced systems track each component through disposition, feeding reliability data back to engineering teams for product improvements.
Investment varies by industry complexity and service-level commitments. Technology service organizations typically maintain parts inventory equal to 2-4% of annual service revenue. Industrial equipment manufacturers range 3-6%. Aviation and medical sectors with strict regulatory requirements may reach 8-12%. Multi-echelon distribution strategies increase investment 40-120% compared to centralized models, but improve first-time fix rates by 15-30 percentage points.
Parts availability directly determines first-time fix rates, which drive SLA performance. Organizations with 85%+ fill rates achieve 90%+ first-time fix performance, minimizing repeat visits and penalty clauses. Each percentage point improvement in parts availability translates to approximately 1.2 percentage points in SLA compliance. Companies with penalties exceeding $500K annually typically justify significant inventory investments to eliminate downtime-related financial exposure.
Modern systems integrate IoT sensors for predictive failures, AI-driven demand forecasting, and mobile inventory management. RFID tracking monitors van stock in real-time, triggering automatic replenishment. Cloud-based platforms synchronize central warehouses, regional depots, and technician inventories. Blockchain emerging for serialized component traceability in regulated industries. Integration with ERP, CRM, and dispatch systems creates closed-loop visibility from failure prediction through repair completion and parts consumption analysis.
Product lifecycle management teams forecast end-of-service dates and calculate final lifetime buys. Organizations balance holding costs against future availability risk. Common strategies include negotiated buy-back agreements with suppliers, secondary market sales through specialized brokers, component harvesting for refurbishment programs, and documented scrap disposition for audit compliance. Tax regulations in most jurisdictions allow inventory write-downs for obsolete items, but require supporting documentation proving zero market value.
Forward stocking locations are strategically positioned mini-warehouses closer to customer concentrations than central distribution centers. They stock 200-800 fast-moving SKUs based on regional equipment populations and failure patterns. Typical locations include third-party logistics providers, service partner facilities, or dedicated regional hubs. They reduce emergency freight costs, improve response times, but increase inventory holding and facility expenses. Break-even analysis typically requires 50+ service calls monthly within 2-hour drive radius.
HVAC, agricultural equipment, and retail technology sectors experience pronounced seasonality. Inventory planners build safety stock 60-90 days before peak seasons using historical demand patterns. Challenge lies in balancing peak-season availability against off-season carrying costs. Advanced strategies include flexible warehouse space contracts, consignment arrangements with suppliers for seasonal items, and dynamic reallocation between geographic regions following seasonal patterns. Failure to anticipate seasonal spikes causes stockouts during revenue-critical periods.
DocShipper provides end-to-end logistics solutions for international field service operations including emergency air freight coordination, customs brokerage for temporary imports, ATA Carnet administration, and reverse logistics management for warranty returns. Our global network enables same-day customs clearance for time-critical components, while our compliance expertise prevents documentation delays that breach service-level commitments. We manage the complete parts journey from supplier to field technician to return disposition.
Key performance indicators include fill rate from available stock, stockout frequency per service call, emergency freight percentage of total logistics spend, inventory turns by SKU category, obsolescence write-offs as percentage of inventory value, average return processing time, and cost per service transaction. Leading organizations establish cross-functional dashboards integrating supply chain, service operations, and finance metrics. Performance targets tie directly to customer satisfaction scores and contract renewal rates, creating accountability throughout the service parts supply chain.
Need Help with
Logistics or Sourcing ?
First, we secure the right products from the right suppliers at the right price by managing the sourcing process from start to finish. Then, we simplify your shipping experience - from pickup to final delivery - ensuring any product, anywhere, is delivered at highly competitive prices.


Fill the Form
Prefer email? Send us your inquiry, and we’ll get back to you as soon as possible.
Contact us