In short ⚡
Float refers to the flexible time buffer between scheduled activities in a supply chain or project timeline. In logistics, it represents the maximum delay tolerance without impacting the critical path or final delivery deadline. Float is measured in days or hours and helps identify schedule flexibility and risk exposure across transport, warehousing, and customs operations.Introduction
Many logistics professionals confuse float with simple slack or buffer time, but this misunderstanding can lead to critical delivery failures. Float is a precise scheduling concept that determines which activities can be delayed without jeopardizing the entire shipment timeline.
In international freight operations, understanding float becomes essential when coordinating multiple stakeholders—carriers, customs brokers, warehouses, and end customers. A single miscalculation can cascade into port demurrage fees, missed production windows, or contract penalties.
Key characteristics of float in logistics include:
- Total Float: Maximum delay allowed without affecting the final deadline
- Free Float: Delay possible without impacting the next dependent activity
- Critical Path Activities: Tasks with zero float that directly determine project duration
- Time Buffers: Intentional float added to absorb unforeseen disruptions
- Resource Optimization: Float enables efficient allocation of labor, equipment, and capital
Float Analysis & Expert Insight
Float calculation follows the Critical Path Method (CPM), a project management technique adapted for supply chain scheduling. The formula distinguishes between forward pass (earliest start/finish) and backward pass (latest start/finish) calculations.
Total Float = Late Finish – Early Finish = Late Start – Early Start. Activities with zero float form the critical path—any delay here directly extends the entire project timeline. Free Float measures the margin before affecting successor tasks: Free Float = Early Start (successor) – Early Finish (current activity).
In customs clearance operations, float becomes particularly strategic. Import documentation processing typically has 2-3 days of total float before storage fees accumulate. However, regulatory inspections (USDA, FDA, EU border controls) often sit on the critical path with zero tolerance for delay.
The Project Management Institute emphasizes that float is not “free time” but a risk management tool. Consuming float early in a shipment lifecycle leaves no buffer for customs holds, weather delays, or carrier rollovers.
At DocShipper, we calculate float for every shipment leg during route planning. This allows us to identify schedule compression opportunities and proactively communicate realistic delivery windows to clients, avoiding the common industry practice of overpromising tight deadlines.
Advanced logistics platforms now incorporate probabilistic float analysis, using historical data to assign confidence intervals rather than fixed buffers. A 5-day float might have 90% reliability for ocean freight but only 60% for last-mile delivery in congested urban zones.
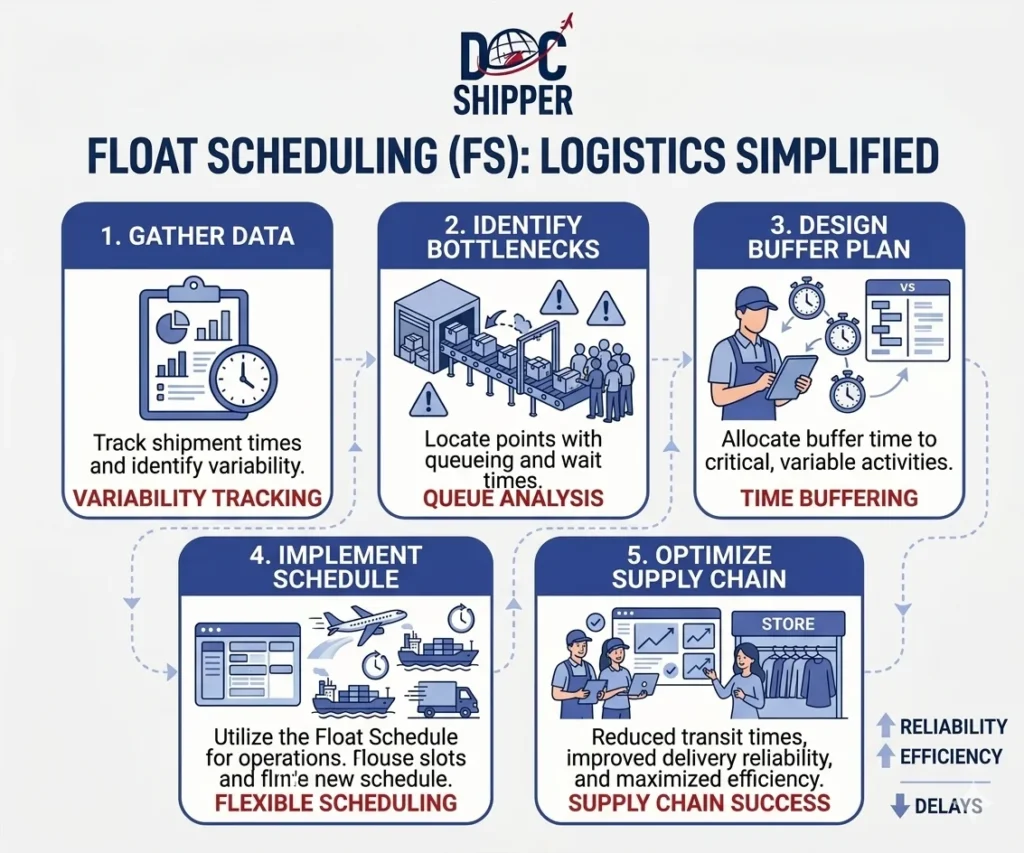
Concrete Examples & Data
Consider a container shipment from Shanghai to Rotterdam with the following schedule:
| Activity | Duration | Total Float | Critical Path |
|---|---|---|---|
| Factory to Shanghai Port | 2 days | 1 day | No |
| Customs Export Clearance | 1 day | 0 days | Yes |
| Ocean Transit | 28 days | 0 days | Yes |
| Port Discharge & Deconsolidation | 3 days | 2 days | No |
| EU Customs Import Clearance | 2 days | 0 days | Yes |
| Final Delivery to Warehouse | 1 day | 1 day | No |
This schedule reveals that customs procedures and ocean transit form the critical path with zero float. The 3 days of combined float in non-critical activities can absorb minor delays but cannot compensate for carrier schedule changes or inspection holds.
Use Case: A European electronics importer faces a product launch deadline. Their freight forwarder schedules a 35-day door-to-door timeline with 4 days total float. When the vessel encounters a 2-day typhoon delay (consuming float), a subsequent 3-day customs documentation issue pushes delivery beyond the launch date, resulting in €250,000 in lost pre-orders.
Industry data from the World Bank Logistics Performance Index shows that 72% of supply chain delays occur in activities incorrectly assumed to have float. Proper float analysis reduces late deliveries by 40-60% across container shipping operations.
Key operational insights:
- Dynamic Float Monitoring: Real-time tracking systems recalculate float as delays occur
- Seasonal Variability: Pre-holiday periods reduce effective float by 30-50% due to congestion
- Carrier Reliability: Alliance carriers maintain schedules 85% of the time vs. 65% for non-alliance vessels
- Customs Float Erosion: Post-pandemic inspections increased by 18%, reducing average float in clearance activities
- Cost-Float Trade-off: Expedited services reduce transit time but eliminate float for cost optimization
Conclusion
Float management transforms logistics from reactive firefighting to strategic schedule control. Understanding which activities have flexibility and which sit on the critical path enables smarter risk mitigation and client communication.
Need expert float analysis for your shipments? Contact DocShipper for comprehensive route planning and proactive delay management.
📚 Quiz
Test Your Knowledge: Float in Logistics
1. What does "float" represent in logistics scheduling?
2. Which statement about critical path activities is correct?
3. A container shipment has 4 days of total float. The vessel encounters a 2-day typhoon delay, then customs documentation issues cause a 3-day hold. What happens?
🎯 Your Result
📞 Free Quote in 24hFAQ | Float: Definition, Calculation & Concrete Examples in Logistics
Total float measures the maximum delay possible without affecting the final delivery deadline, while free float indicates how much an activity can be delayed without impacting the start of the next dependent task. Total float considers the entire project timeline; free float focuses on immediate successor activities. In practice, free float is always less than or equal to total float and is more relevant for daily operational decisions.
Calculate float using the Critical Path Method: determine the earliest and latest possible start/finish dates for each activity. Total Float = Latest Finish Date - Earliest Finish Date. Map all shipment activities (pickup, customs, transit, delivery) with dependencies, then identify the longest path (critical path) with zero float. All other activities will show positive float values representing schedule flexibility.
Yes, negative float occurs when an activity is already behind schedule relative to the required completion date. This indicates the project deadline cannot be met without schedule compression (expediting specific tasks) or scope changes. Negative float is common after unexpected customs holds, port strikes, or carrier delays on the critical path. It signals urgent need for corrective action.
Critical path activities have zero float because any delay directly extends the total project duration—their earliest and latest start/finish dates are identical. These tasks have no scheduling flexibility and require closest monitoring. In international shipping, ocean transit and customs clearance typically fall on the critical path, meaning delays here immediately push back final delivery dates.
Float serves as a buffer against unforeseen disruptions like weather delays, equipment failures, or documentation issues. Activities with positive float can absorb delays without jeopardizing deadlines, allowing logistics managers to allocate resources to critical path tasks. Proper float analysis enables realistic delivery commitments and identifies where to invest in expedited services or backup plans for high-risk shipments.
Float in port operations determines the available time before demurrage charges begin accruing. Container free time (typically 3-7 days) represents built-in float for cargo pickup. Once this float is consumed, daily demurrage fees apply. Effective float management ensures customs clearance and inland transport align with free time windows, avoiding penalties that can reach $100-300 per container per day.
Peak seasons (pre-Christmas, Chinese New Year) reduce effective float through port congestion, carrier rollovers, and customs backlogs. A route with 5 days float in low season might functionally have only 2 days during peak periods. Experienced forwarders adjust float assumptions seasonally, often adding 20-30% buffer time to critical path activities during known congestion windows to maintain schedule reliability.
No, increasing float for an activity requires either reducing its duration or starting it earlier—both of which may affect total project length if not carefully managed. However, you can redistribute float by optimizing non-critical activities. For example, accelerating documentation preparation creates float in subsequent clearance steps without extending the shipment timeline, providing more buffer where disruptions are likely.
Enterprise logistics platforms like SAP TM, Oracle SCM, and specialized tools such as Microsoft Project, Primavera P6, and LogixGRID incorporate CPM-based float calculations. Modern TMS (Transportation Management Systems) increasingly offer real-time float monitoring integrated with carrier tracking data. These systems automatically recalculate float as delays occur, triggering alerts when critical path activities are at risk.
Float visibility enables accurate, transparent delivery forecasting. Instead of promising fixed dates, logistics providers can communicate confidence intervals: "Your shipment has 3 days of schedule buffer, giving us 90% confidence in the June 15th delivery window." This manages expectations realistically and builds trust. When float is consumed by delays, proactive communication with updated timelines becomes possible before customers experience service failures.
Float is a time-based scheduling buffer, while safety stock is an inventory buffer. Float addresses uncertainty in activity duration and timing; safety stock addresses uncertainty in demand and supply variability. Both serve risk mitigation but in different dimensions—float protects delivery schedules, safety stock protects against stockouts. Optimal supply chain design balances both, sometimes trading longer float (slower shipping) for lower safety stock costs.
Force majeure events (natural disasters, wars, pandemics) can completely eliminate float by disrupting critical path activities beyond normal variability. Port closures, flight cancellations, or border shutdowns consume all available float and often create negative float scenarios. Contingency planning for such events involves identifying alternative routing with independent float (different carriers, ports, or modes) rather than relying on single-path buffers that vanish under systemic shocks.
Need Help with
Logistics or Sourcing ?
First, we secure the right products from the right suppliers at the right price by managing the sourcing process from start to finish. Then, we simplify your shipping experience - from pickup to final delivery - ensuring any product, anywhere, is delivered at highly competitive prices.


Fill the Form
Prefer email? Send us your inquiry, and we’ll get back to you as soon as possible.
Contact us