10 Global Sourcing Statistics You Should Know

1) 53% of organizations plan to increase their focus on sustainable sourcing. This shift reflects a growing commitment to environmental responsibility, as companies recognize that sustainable practices can enhance brand reputation and customer loyalty.
2) $1.3 billion is the projected value of global AI adoption in procurement by 2024. This significant investment underscores the transformative potential of AI technologies in streamlining operations and driving efficiency across supply chains & logistics world.
3) 59% of US buyers and 68% of EU-based buyers intend to maintain or boost their purchasing from China in 2024. This trend highlights the continued reliance on Chinese suppliers, despite challenges such as geopolitical tensions and supply chain disruptions.
4) Did you know that China historically held 67% of the sourcing volumes for US and EU buyers. While this dominance is decreasing, it underscores the need for companies to diversify their sourcing strategies to mitigate risks associated with over-reliance on a single market.
5) 11-30% of total sourcing value or volume for US companies typically comes from Vietnam. This statistic illustrates Vietnam’s growing importance as a strategic sourcing destination, particularly for businesses looking to reduce dependence on China.
6) The US was the third-largest apparel exporter globally in 2015, following China and Bangladesh. This ranking emphasizes the potential for US manufacturers to reclaim market share as companies seek to localize supply chains in response to global disruptions.
7) Approximately 44.5% of enterprises in the EU and Norway engage in international sourcing within the EU. This statistic highlights the significance of regional partnerships and the benefits of the European Single Market in facilitating trade.
8) About 55.5% of enterprises in the EU and Norway reported job creation due to international sourcing. This positive outcome demonstrates how global trade can contribute to local economies by fostering employment opportunities within the supply chain & Logistics industry.
9) Around 20-30% of US and EU buyers plan to maintain or increase their purchasing from Africa in the next 2-3 years. This trend indicates a growing interest in diversifying supply chains and exploring new markets for sourcing.
10) A striking 77% of EU companies sourcing abroad do so within the EU, emphasizing the importance of intra-European trade and the advantages of a unified market in reducing logistical complexities.
10 Revealing Supply Chain & logistics Statistics

11) More than 6 out of 10 global organizations expect geopolitical instability to negatively impact their supply chains in the next three years. This statistic reveals a growing concern among businesses about the unpredictable nature of global politics and its potential to disrupt operations.
12) 71% of global companies identify rising raw material costs as their top supply chain threat. This highlights the increasing pressure on businesses to manage costs effectively while ensuring a steady supply of essential materials.
13) 6 in 10 organizations plan to invest in digital technology to enhance their supply chain processes. This shift towards digitalization underscores the recognition that advanced technologies can improve efficiency and data analysis capabilities.
14) 55.6% of businesses view cybersecurity as a primary concern for supply chain resilience. This statistic emphasizes the critical need for robust cybersecurity measures to protect sensitive data and maintain operational integrity.
15) Did you know that the average cost of a supply chain disruption is $1.5 million per day. This staggering figure illustrates the financial risks associated with interruptions, underscoring the importance of proactive risk management strategies.
16) 67% of organizations consider meeting customer expectations for speedy delivery as a key factor shaping their supply chain structures in the next 12-18 months. This statistic reflects the growing demand for faster delivery times and the competitive pressure it places on businesses.
17) 38% of enterprises are actively optimizing their supply chain technology. This indicates a trend towards leveraging advanced technologies to streamline operations and improve overall efficiency.
18) 50% of supply chain organizations plan to invest in AI-powered applications and advanced analytics through 2024. This investment highlights a commitment to harnessing artificial intelligence to enhance decision-making and operational effectiveness.
19) AI is expected to make supply chains 45% more effective in delivering products on time and without errors. This statistic showcases the transformative potential of AI in optimizing logistics and improving customer satisfaction.
20) More than 80% of warehouses currently lack automation. This statistic points to a significant opportunity for businesses to enhance efficiency and reduce labor costs by adopting automated solutions in their storage operations.
10 Important Statistics on Shipping and Freight Forwarding

21) 31,140 companies operate in the freight forwarding industry in the United States. This statistic underscores the competitive nature of the market and the opportunities for growth and innovation within the sector.
22) 41% of logistics providers consider technology a strong factor, indicating that its role in freight forwarding will increase. This trend highlights the industry’s recognition of the importance of digital solutions in enhancing efficiency and competitiveness.
23) The top 10 companies account for 43% of the global freight forwarding market. This concentration of market share among a few major players suggests the potential for consolidation and the need for smaller firms to differentiate themselves through specialized services or niche markets.
24) 54% of freight forwarders plan to implement a digital transformation strategy, demonstrating a commitment to leveraging technology to streamline operations and improve customer service. This statistic reflects the industry’s efforts to adapt to changing market demands and stay ahead of the curve.
25) 74% of supply chain companies utilize 4 or 5 transportation methods, including road full truckload and air freight. This multimodal approach allows for greater flexibility and efficiency in meeting the diverse needs of shippers, while also reducing the environmental impact of transportation.
26) The Sea and Air Freight Forwarding market size is projected to grow to USD 1.9 trillion in 2032. This impressive forecast highlights the continued importance of these modes of transportation in global trade and the potential for further growth and innovation within the sector.
27) Shippers can minimize freight invoice payments by 90-95% if they utilize a transportation management system. This statistic demonstrates the significant cost savings that can be achieved through the adoption of advanced technologies in freight management.
28) The global Freight Forwarder market was valued at US$ 386.7 million in 2023 and is anticipated to reach US$ 559.6 million by 2030. This growth trajectory underscores the resilience and potential of the freight forwarding industry, despite the challenges posed by the global economic downturn and other market disruptions.
29) 34% of shipping and logistics firms lack a digital transformation strategy but are considering one, highlighting the industry’s ongoing shift towards digital technologies. This statistic suggests that while some companies have already embraced digital solutions, there is still significant room for growth and adoption within the sector.
30) The freight forwarding market is expected to grow with a Compound Annual Growth Rate (CAGR) of more than 4% during the forecast period of 2021-2026. This steady growth rate indicates the industry’s stability and the potential for continued expansion in the coming years, driven by factors such as globalization, e-commerce, and the increasing demand for efficient and reliable logistics services.
10 Notable Facts About Air Freight

31) Air freight ton kilometers are projected to reach 280.8 billion by 2026. This significant growth indicates a strong demand for air cargo services, driven by global trade expansion and e-commerce.
32) Air freight accounts for less than 1% of global trade by volume but a remarkable 35% by value. This highlights the critical role air freight plays in transporting high-value goods quickly and efficiently.
33) E-commerce is expected to represent 20% of total air cargo by 2030. This statistic reflects the increasing reliance on air freight for fast delivery of online purchases, reshaping the logistics landscape.
34) Global air freight traffic is predicted to more than double over the next two decades. This anticipated surge underscores the growing importance of air cargo in facilitating international trade and commerce.
35) Air cargo contributes to about 10% of airline revenue on a global scale. This statistic emphasizes the financial significance of freight services for airlines, complementing their passenger operations.
36) The cargo sector of the aviation industry has reduced **CO2 emissions per ton-km by50% since 1990. This achievement highlights the industry’s commitment to sustainability and minimizing its environmental impact.
37) Air freight costs $0.61 per ton-mile, which is over ten times more than sea freight. This stark difference illustrates the premium associated with the speed and efficiency of air transport.
38) The average age of air cargo aircraft is around 21.6 years. This statistic points to the need for modernization in the fleet to enhance efficiency and reduce operational costs.
39) Hong Kong International Airport is the busiest cargo airport in the world. This status underscores Hong Kong’s strategic position as a global logistics hub, facilitating trade across Asia and beyond.
40) The air freight industry supports 65.5 million jobs globally, encompassing both direct and related sectors. This statistic highlights the significant economic impact of air cargo on employment and livelihoods worldwide.
10 Essential Statistics on Sea Freight
41) 90% of international trade, and 76% of all US trade, involves maritime traffic. This statistic emphasizes the pivotal role of shipping in global commerce, highlighting the reliance on sea freight for moving goods across borders.
42) $1.5 trillion worth of goods are shipped in and out of American ports each year. This staggering figure showcases the immense scale of trade facilitated by US ports, underscoring their importance to the national economy.
43) Annually, 11 billion tons of goods are shipped across the world’s oceans, averaging 1.35 tons of goods per person. This statistic illustrates the vast volume of maritime trade and its significance in supporting global consumption patterns.
44) 13 million workers depend on American ports for their jobs. This highlights the critical economic impact of port operations, as they provide livelihoods for millions and contribute to local and national economies.
45) The cargo shipping market size is forecast to increase by USD 58.83 billion between 2023 and 2028. This growth projection indicates a robust demand for shipping services, driven by global trade expansion and economic recovery.
46) More than 55,000 merchant ships can be found across the globe. This statistic reflects the extensive fleet available for maritime transport, essential for meeting the demands of international trade.
47) Inspectors at U.S. ports examine a mere 5% of all containers that arrive annually. This low inspection rate raises concerns about security and compliance, highlighting the challenges of managing maritime logistics effectively.
48) Maritime transport accounted for 67.8% of total EU freight transport performance in 2022. This statistic underscores the dominance of sea freight in the European logistics landscape, supporting the region’s trade activities.
49) The European sea freight forwarding market is projected to grow from $75.21 billion in 2024 to $96.86 billion by 2029. This anticipated growth reflects the increasing reliance on maritime logistics within the EU and the potential for further investment in this sector.
50) Approximately 90% of global merchandise is shipped by sea, underscoring the essential role of maritime transportation in facilitating international trade and connecting economies worldwide.
10 Key Insights into Rail Freight

51) In 2022, Germany recorded the highest rail freight transport performance in the EU, representing around 31% of the total. This dominance showcases Germany’s critical role in European logistics and its efficient rail network that supports extensive freight operations.
52) In 2021, rail freight accounted for approximately 16.8% of EU freight transport. This statistic highlights the growing importance of rail as a sustainable and efficient mode of transport within the European logistics landscape.
53) The Asia Pacific Rail Freight Transport Market is valued at around USD 170 billion. This significant market size underscores the region’s rapid growth and its pivotal role in global supply chains, driven by increasing trade and infrastructure development.
54) Asia Rail Freight is expected to account for almost half of global freight activity by 2050. This projection indicates a major shift in freight dynamics, reflecting the region’s expanding economic influence and investment in rail infrastructure.
55) The Asia-Europe rail freight route has experienced continued double-digit growth, with over 50,000 train trips made since the launch of services in 2011. This statistic highlights the increasing efficiency and reliability of rail transport for international trade between these key regions.
56) In 2022, the total rail freight volume in the US was 2.53 trillion tonne-kilometers. This impressive figure illustrates the vast capacity of the US rail network and its essential role in moving goods across the country.
57) The rail freight industry employs over 135,000 Americans. This statistic emphasizes the sector’s contribution to employment and the importance of rail transport in supporting local economies.
58) Railroads account for only 1.9% of transportation-related greenhouse gas emissions in the US. This low percentage highlights the environmental benefits of rail transport compared to other modes, making it a more sustainable option for freight movement.
59) The US rail freight network consists of over 137,000 miles of track, making it the most expansive freight system in the world. This extensive infrastructure is crucial for facilitating efficient transportation of goods across vast distances.
60) US Class I railroads have invested over $250 billion in infrastructure and equipment over the last decade. This substantial investment reflects the industry’s commitment to modernization and improving service reliability in response to growing demand.
10 Important Statistics About Road Freight
- In Europe
61) The road freight transport market in Europe was estimated to be around 350 billion euros in 2018. This substantial market size underscores the critical role of road freight in facilitating trade and commerce across the continent.
62) European road freight transport is expected to increase by 30% between 2005 and 2050. This projected growth highlights the continued reliance on road freight as a primary mode of transportation, driven by factors such as e-commerce and globalization.
63) In Europe, road freight represents about 75% of total inland freight transport. This dominance showcases the efficiency and flexibility of road freight in meeting the diverse needs of shippers across the region.
64) Germany, Poland, France, Spain, and Italy account for almost 60% of the total road freight tonnage transported in the EU. These countries’ significant contributions reflect their economic importance and the strength of their manufacturing and logistics sectors.
65) The total distance traveled by freight on European roads exceeds 1.7 trillion km. This staggering figure highlights the vast network of roads that support the movement of goods across the continent.
66) At the EU level, one-fifth (20.2%) of the total distances traveled by road freight vehicles was performed by empty vehicles in 2022. This statistic points to the need for optimization in freight operations to improve efficiency and reduce environmental impact.
- United States
67) In 2021, the total volume of road freight in the US was 11.8 billion tonnes. This substantial figure demonstrates the reliance on road freight as the primary mode of transportation for goods in the country.
68) Road freight accounts for around 72% of the total freight transport volume in the US. This dominance is comparable to Europe, highlighting the global importance of road freight in facilitating trade and economic growth.
69) In 2021, there were 12.2 million registered trucks in the US. This extensive fleet of vehicles is crucial for meeting the demands of the country’s vast geography and diverse industries.
- Globally
70) Asia accounts for approximately 40% of global road freight volumes, with China, Japan, and South Korea being the largest contributors. This statistic reflects the rapid economic growth and industrialization in the region, driving the demand for efficient road freight services.
10 Multi-Modal Freight Facts Worth Noting

71) Exports to Asia are expected to increase by over 5% in 2024, with 12 of Australia’s top 15 export markets already located in the Asian region. This trend highlights the growing importance of Asia as a key trading partner for Australia, driven by strong demand for goods and services.
72) In 2022, maritime and road transport accounted for 92.7% of total freight transport performance in the EU, while rail transport represented 5.5%, inland waterways 1.6%, and air transport 0.2%. This statistic underscores the dominance of maritime and road transport in the EU logistics landscape, reflecting their efficiency and capacity for handling large volumes of goods.
73) The EU’s freight transport performance was dominated by maritime transport, making up over two-thirds (67.8%) of the total, while road transport accounted for 24.9%. This distribution highlights the critical role of shipping in facilitating trade within Europe, showcasing its reliability for bulk transport.
74) The US Department of Transportation announced $5.1 billion in funding for multimodal freight projects for 2025-2026. This investment reflects the government’s commitment to enhancing infrastructure and improving the efficiency of freight transport across multiple modes.
75) The integration of AI in multimodal transport systems can potentially reduce logistics costs by up to 20%. This statistic illustrates the transformative potential of technology in optimizing operations and driving cost efficiencies in the logistics sector.
76) The National Infrastructure Project Assistance (Mega) program allocates $1.7 billion for large, complex multimodal projects. This funding is crucial for developing infrastructure that supports efficient freight movement, promoting economic growth and connectivity.
77) The Infrastructure for Rebuilding America (INFRA) program has $2.7 billion available for multimodal freight and highway projects. This funding aims to enhance the nation’s transportation network, ensuring that it meets the demands of modern commerce.
78) The Rural Surface Transportation Grant program dedicates $780 million to multimodal projects in rural areas. This investment is vital for improving access and connectivity in underserved regions, supporting local economies and enhancing freight movement.
79) In 2021, multimodal freight contributed to a 25% reduction in greenhouse gas emissions compared to single-mode transport. This statistic highlights the environmental benefits of using multiple transportation modes, promoting sustainability in the logistics industry.
80) Multimodal freight shipments are expected to grow by 4.6% annually, reaching 19.2 billion tons by 2045. This growth projection indicates a significant shift towards integrated transport solutions, reflecting the increasing complexity and demands of global supply chains.
Enhance efficiency, cut costs, and gain 24/7 visibility  over your entire supply chain.
- Cut your shipping costs and maximize your margins
- Manage sourcing, freight, & customs on one platform
- Get real-time tracking and analytics
10 Customs Clearance Statistics You Need to Understand
 81) Implementing automated customs systems can reduce clearance time by up to 80%. This dramatic reduction highlights the transformative impact of technology on customs processes, enabling faster movement of goods across borders and enhancing overall trade efficiency.
82) Efficient customs procedures can lower global trade costs by up to 15%. This statistic underscores the importance of streamlined customs operations in reducing expenses for businesses and promoting smoother international trade.
83) 60% of e-commerce companies cite customs clearance as a major barrier to international expansion. This reveals the challenges that online retailers face when navigating complex customs regulations, hindering their ability to reach new markets.
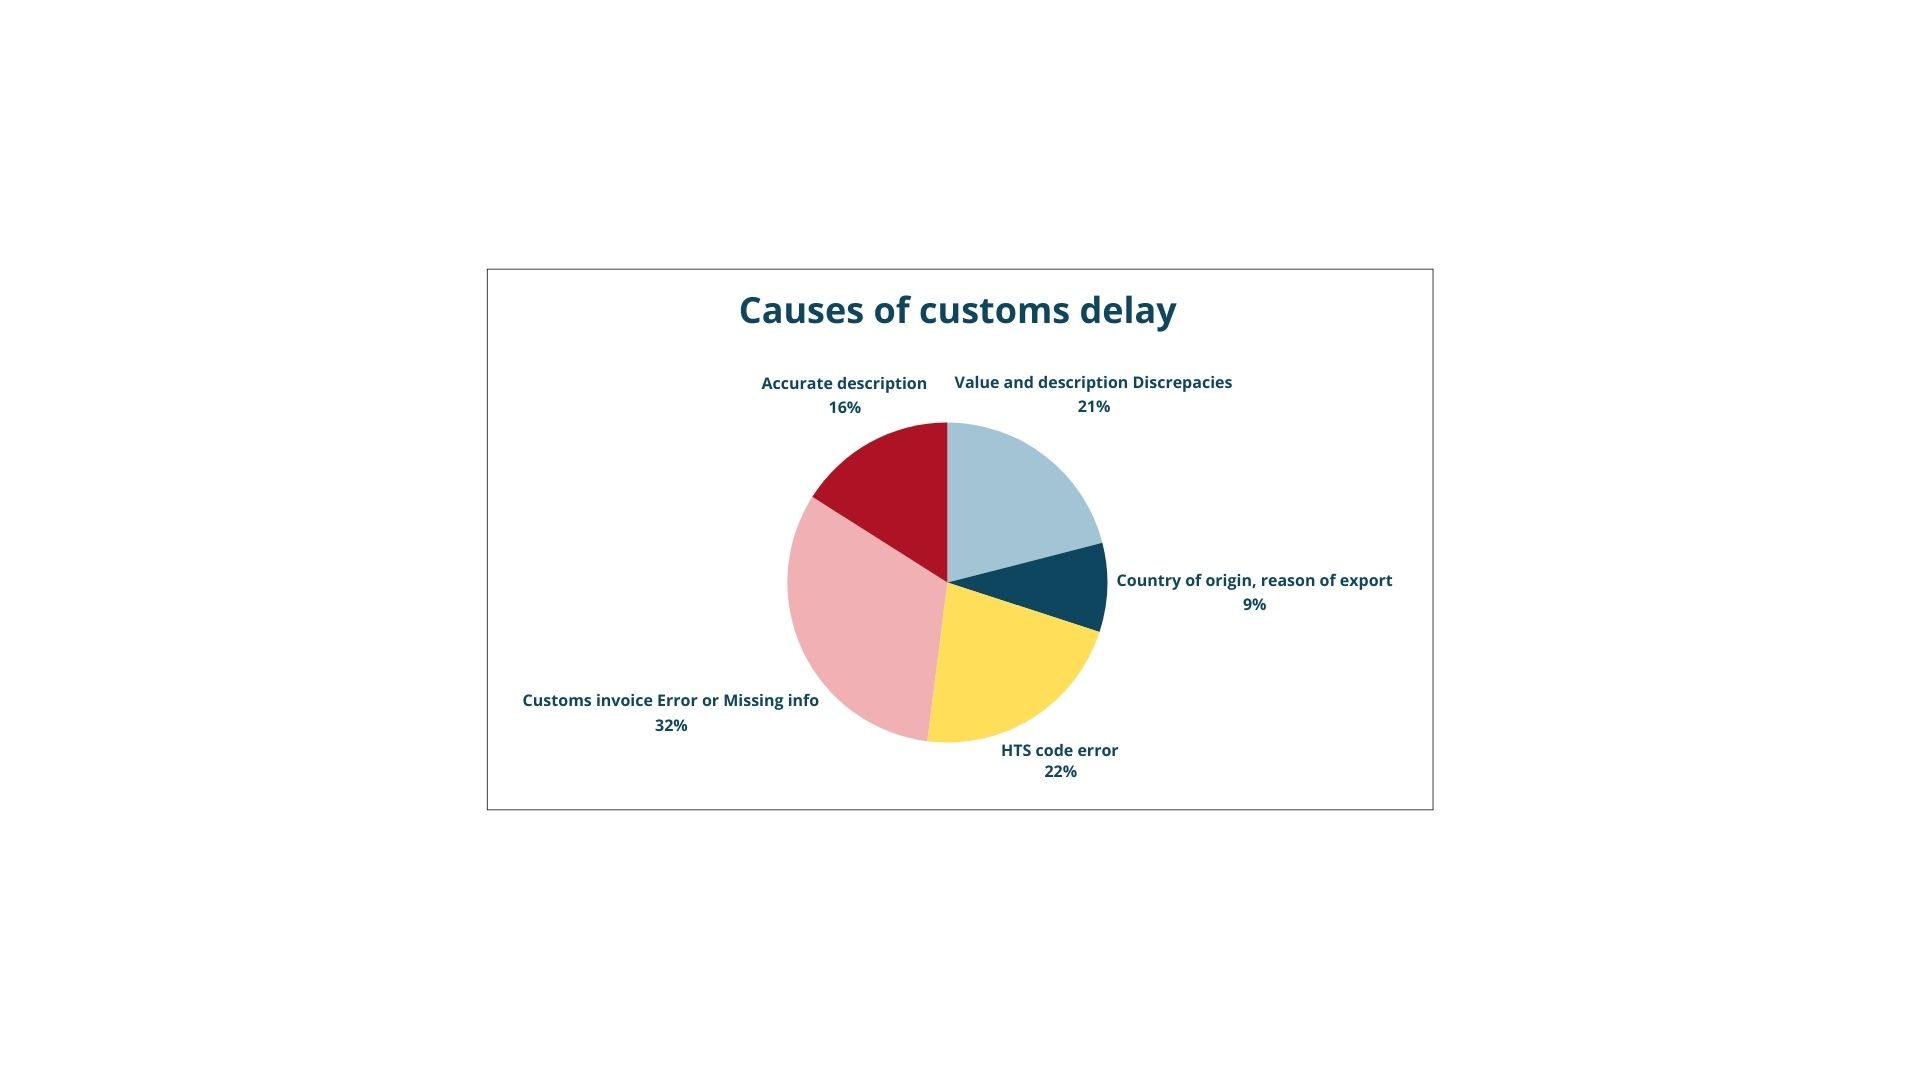
84) Customs delays contribute to an average of 7% additional logistics costs for businesses. This figure illustrates the financial impact of inefficiencies in customs processes, emphasizing the need for improvements to minimize delays and associated costs.
85) 70% of companies report that complying with customs regulations is the most challenging part of their supply chain. This statistic highlights the complexities and burdens that customs compliance imposes on businesses, affecting their operational efficiency.
86) The use of blockchain technology in customs can potentially save $31 billion in global trade costs by 2030. This projection showcases the promise of innovative technologies in enhancing transparency and efficiency in customs operations.
87) Countries with simplified customs procedures see up to 20% higher trade volumes. This statistic emphasizes the direct correlation between streamlined customs processes and increased trade activity, benefiting economies as a whole.
88) On average, customs clearance requires about 2 to 5 hours of document processing. This timeframe illustrates the time-consuming nature of customs procedures, highlighting the need for automation and efficiency improvements.
89) Over 90% of international shippers use customs brokers to handle their customs clearance processes. This reliance on experts underscores the complexity of customs regulations and the importance of professional assistance in navigating them.
90) Annually, customs duties and tariffs generate approximately $1.2 trillion in revenue globally. This significant revenue stream highlights the critical role of customs in government finance and the importance of effective customs management in facilitating trade.
10 Surprising Facts About the Logistics Industry You Didn’t See Coming
91) Over 90% of the world’s goods are transported by sea, yet only 10% of shipping containers are ever inspected. This highlights the vast scale of maritime trade and the challenges in ensuring security and compliance.
92) The logistics industry is responsible for approximately 12% of global GDP, making it one of the most significant sectors in the world economy. This statistic emphasizes the industry’s crucial role in facilitating trade and economic growth.
93) Every year, around 300,000 new jobs are created in the logistics sector in the United States alone. This growth reflects the increasing demand for logistics services and the industry’s importance to the economy.
94) The largest container ships can carry over 24,000 TEUs (Twenty-foot Equivalent Units), equivalent to the volume of around 1,000 elephants ! This showcases the incredible capacity of modern shipping vessels.
95) Trucking accounts for about 70% of all freight transported in the U.S., highlighting the critical role of road transport in the logistics network.
96) The average consumer spends about $1,500 annually on shipping costs, reflecting the hidden expenses associated with online shopping and e-commerce.
97) Logistics companies are increasingly adopting drones for last-mile delivery, with projections that drone deliveries could reduce delivery times by up to 30%.
98) The logistics industry is one of the largest consumers of energy, accounting for about 30% of global energy consumption, which raises concerns about sustainability and environmental impact.
99) In 2022, the logistics sector faced a shortage of around 80,000 truck drivers in the U.S., significantly impacting supply chain efficiency and delivery times.
100) Innovative technologies like blockchain are expected to save the logistics industry up to $31 billion by 2030, demonstrating the potential for tech-driven solutions to enhance efficiency and transparency.


Fill the Form
Prefer email? Send us your inquiry, and we’ll get back to you as soon as possible.
Contact us 