In short ⚡
The 5-Point Annual Average is a statistical method used in international trade and logistics to smooth out short-term fluctuations by calculating the mean value across five consecutive annual periods. This technique provides more stable trend indicators for forecasting, budgeting, and strategic planning in supply chain management.
Introduction
Import-export professionals frequently struggle with volatile data. Shipping volumes, freight rates, and customs clearance times can swing dramatically month-to-month. Basing strategic decisions on a single year’s performance often leads to costly miscalculations.
The 5-Point Annual Average addresses this challenge. By analyzing data across five consecutive years, businesses gain clearer visibility into genuine trends versus temporary anomalies. This methodology proves particularly valuable for budget allocation, carrier negotiations, and warehouse capacity planning.
Key characteristics of this approach include:
- Volatility reduction: Minimizes impact of exceptional years (pandemic disruptions, trade wars)
- Trend identification: Reveals underlying growth or decline patterns
- Forecasting accuracy: Provides reliable baseline for projections
- Stakeholder confidence: Demonstrates data-driven decision-making to investors and partners
- Risk mitigation: Prevents over-commitment based on temporary peaks
Technical Framework & Calculation Methodology
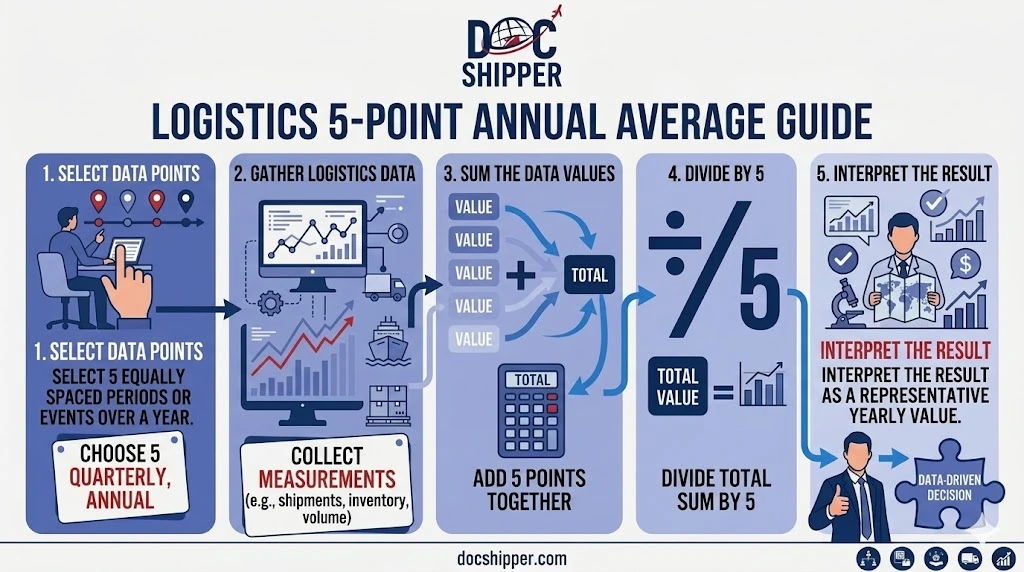
The 5-Point Annual Average calculation follows a straightforward mathematical formula. Sum the values from five consecutive years, then divide by five. However, application in international logistics requires strategic context interpretation.
Rolling average implementation: Most sophisticated logistics operations use a rolling 5-year window. As each new year completes, the oldest data point drops from the calculation. This maintains relevance while preserving smoothing benefits.
Weighted variations: Some organizations apply weighting coefficients, giving recent years greater influence. For example, a 5-4-3-2-1 weighting system assigns five times the importance to the current year versus the oldest data point. This hybrid approach balances stability with responsiveness to emerging trends.
Seasonal adjustment considerations: International shipping experiences seasonal patterns (pre-holiday surges, post-Chinese New Year slowdowns). The 5-Point Annual Average naturally absorbs these cycles when calculated on full-year data. However, analysts must recognize that intra-year variations remain outside this methodology’s scope.
Data quality requirements: The method assumes consistent measurement standards across the five-year period. Changes in accounting practices, shipping route definitions, or cargo classification systems can introduce artificial distortions. At DocShipper, we maintain standardized data collection protocols across all client operations to ensure calculation integrity.
According to World Trade Organization statistical guidelines, multi-year averaging techniques are recommended for developing baseline trade projections. The WTO specifically endorses five-year periods as balancing historical perspective with current relevance.
Practical Applications & Case Studies
Consider a European electronics importer analyzing annual container volumes from Asia:
| Year | Annual TEU Volume | Notes |
|---|---|---|
| 2019 | 840 TEU | Normal operations |
| 2020 | 620 TEU | COVID-19 disruption |
| 2021 | 1,140 TEU | Recovery surge |
| 2022 | 890 TEU | Normalization begins |
| 2023 | 910 TEU | Stabilization |
| 5-Point Annual Average | 880 TEU |
The 880 TEU average provides a more reliable planning figure than any single year. Using 2021’s peak (1,140 TEU) would lead to overcapacity investments. Conversely, 2020’s trough (620 TEU) would create capacity shortages.
Freight rate negotiation example: A pharmaceutical exporter uses 5-Point Annual Average spending to negotiate volume-based discounts. Rather than citing volatile single-year figures, they present averaged data showing consistent $4.2 million annual freight expenditure. This strengthens negotiating position with carriers seeking stable, predictable partnerships.
Warehouse dimensioning case: A US automotive parts distributor calculated a 5-Point Annual Average of 32,000 cubic meters storage requirement. This informed their decision to lease a 35,000 m³ facility with expansion options, rather than committing to a 45,000 m³ space based on a single peak year. The approach saved $380,000 annually in unnecessary lease costs.
Customs compliance application: Importers subject to periodic audits use 5-Point Annual Averages to demonstrate typical import values and volumes. This historical pattern helps customs authorities distinguish legitimate business fluctuations from potential undervaluation or smuggling indicators.
At DocShipper, we apply this methodology when developing long-term logistics strategies for clients. Our supply chain consultants integrate 5-Point Annual Averages into capacity planning models, ensuring recommendations align with sustainable growth trajectories rather than temporary market conditions.
Conclusion
The 5-Point Annual Average delivers strategic clarity in an inherently volatile industry. By smoothing short-term fluctuations, this method enables confident decision-making on capacity investments, contract negotiations, and resource allocation. International trade professionals who master this analytical tool gain competitive advantage through superior forecasting accuracy.
Need expert guidance on implementing data-driven logistics strategies? Contact DocShipper’s supply chain consultants to optimize your international operations.
📚 Quiz
Test Your Knowledge: 5-Point Annual Average
1. What is the primary purpose of using a 5-Point Annual Average in international logistics?
2. A company had shipping volumes of 500, 300, 800, 600, and 700 TEU over five consecutive years. Should they base their warehouse capacity planning on the peak year (800 TEU) or the 5-Point Annual Average?
3. Your logistics team wants to present reliable shipping data during carrier contract negotiations. Which approach demonstrates greater partnership stability?
🎯 Your Results
📞 Free Personalized QuoteFAQ | 5-Point Annual Average: Definition, Calculation & Practical Examples
Both use five data points, but 5-Point Annual Average specifically references complete yearly cycles, making it ideal for capturing seasonal business patterns. Simple moving averages can use any time period (weeks, months) and don't necessarily align with fiscal or calendar years. The annual focus makes the 5-Point method particularly suited to budgeting and strategic planning in international trade.
Not directly. The methodology requires annual data points to maintain its statistical validity. However, you can calculate a 5-month moving average for shorter-term trend analysis. For monthly data spanning multiple years, consider calculating annual totals first, then applying the 5-Point Annual Average to those yearly figures.
Wait until the year completes to maintain calculation integrity. Including partial-year data introduces seasonality bias. If immediate analysis is required, you can annualize the partial year (multiply by the appropriate factor), but clearly document this approach and recalculate once actual full-year data becomes available.
Generally no. The method's purpose is absorbing volatility, including exceptional years. Manually excluding outliers defeats the smoothing objective and introduces subjective bias. If truly extraordinary circumstances occurred (company merger, complete market shift), consider calculating two averages: one including the outlier for comprehensive history, another excluding it for forward-looking projections.
You need exactly five complete years of data to calculate the average. However, statistical reliability improves with additional historical context. Best practice involves calculating rolling 5-Point Annual Averages across at least eight to ten years of records, allowing you to observe how the average itself evolves over time.
Significant exchange rate movements can distort averages based on monetary values. Convert all historical data to constant currency (typically current exchange rates or inflation-adjusted figures) before calculating the average. This isolates operational trends from financial market volatility, providing clearer operational insights.
It provides a baseline expectation, not a precise forecast. The average reflects historical patterns and should be adjusted for known future changes (new product launches, market expansions, regulatory shifts). Combine the 5-Point Annual Average with trend analysis and external market intelligence for comprehensive forecasting.
Update annually when each new fiscal year completes. Some organizations recalculate quarterly using rolling methodology, but this reduces the smoothing effect. Monthly recalculation is counterproductive, as the average wouldn't change significantly and defeats the purpose of reducing short-term volatility.
Five-year averages provide superior smoothing for strategic decisions (facility investments, long-term contracts). Three-year averages respond faster to genuine market shifts, making them suitable for tactical adjustments. Many sophisticated operations calculate both, using the 5-year average for foundational planning and 3-year figures to detect emerging trend changes.
Customs valuation requires transaction-specific pricing, not averaged figures. However, the 5-Point Annual Average can support risk assessment profiles and demonstrate consistent business patterns during audits. It's a supplementary analytical tool, not a substitute for actual transaction documentation.
It demonstrates commitment stability to carriers. Presenting averaged shipping volumes shows you're a reliable, predictable partner rather than an opportunistic spot-rate buyer. This strengthens your position when negotiating volume discounts, priority service levels, or multi-year rate agreements with preferential terms.
Yes, when product categories have distinct shipping characteristics, seasonality patterns, or growth trajectories. Aggregating diverse products into a single average can mask important category-specific trends. Calculate separate averages for each significant product line, then create a weighted composite average if overall portfolio visibility is needed.
Need Help with
Logistics or Sourcing ?
First, we secure the right products from the right suppliers at the right price by managing the sourcing process from start to finish. Then, we simplify your shipping experience - from pickup to final delivery - ensuring any product, anywhere, is delivered at highly competitive prices.


Fill the Form
Prefer email? Send us your inquiry, and we’ll get back to you as soon as possible.
Contact us