In short ⚡
Forecast is a data-driven projection of future demand, inventory needs, or shipment volumes used to optimize supply chain planning. In international logistics, accurate forecasting enables companies to anticipate container bookings, warehouse capacity, and customs clearance requirements, minimizing delays and reducing storage costs.
Introduction
Many importers struggle with unpredictable shipping schedules, leading to stockouts or excessive warehousing fees. Without reliable forecasting, businesses face container booking conflicts, missed production deadlines, and last-minute air freight costs that erode profit margins.
In global trade, forecasting acts as the foundation for inventory management, carrier negotiations, and regulatory compliance. It transforms reactive logistics into proactive strategy, ensuring goods arrive when needed without capital tied up in overstocked warehouses.
Key characteristics of logistics forecasting include:
- Demand prediction: Estimating customer orders based on historical sales, seasonal trends, and market analysis.
- Lead time calculation: Projecting production cycles, transit durations, and customs clearance timelines.
- Capacity planning: Determining container volumes, warehouse space, and transportation modes required.
- Risk mitigation: Identifying potential disruptions like port congestion, regulatory changes, or supplier delays.
- Budget optimization: Allocating funds for freight, duties, and storage based on projected shipment volumes.
In-Depth Analysis & Expertise
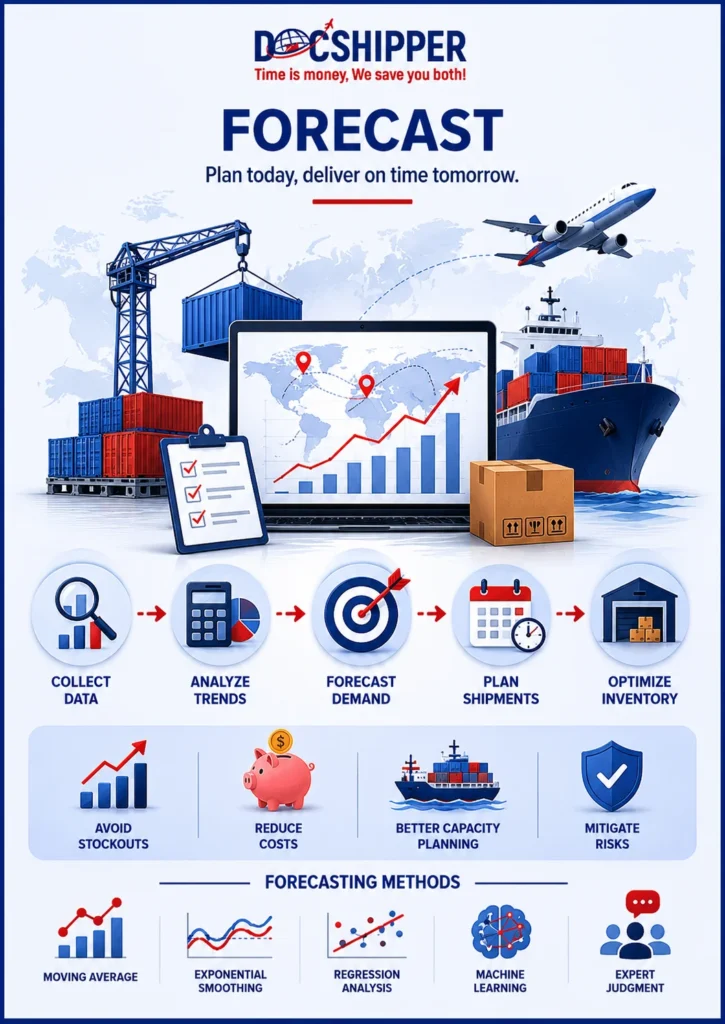
Forecasting methodologies vary by industry complexity and data availability. Quantitative forecasting relies on statistical models like moving averages, exponential smoothing, and regression analysis. These techniques analyze historical shipment data to identify patterns and project future volumes.
Qualitative forecasting incorporates expert judgment, market research, and sales team input. This approach proves valuable when launching new products or entering emerging markets where historical data is limited. Combining both methods creates hybrid models that balance statistical rigor with real-world business insights.
The forecast horizon defines the planning period—short-term forecasts (weeks to months) guide operational decisions like container bookings, while long-term projections (quarters to years) inform strategic choices such as warehouse expansions or carrier contracts. Shorter horizons typically yield higher accuracy due to reduced uncertainty.
Forecast accuracy measures the difference between predicted and actual outcomes. Metrics like Mean Absolute Percentage Error (MAPE) or Bias quantify reliability. A MAPE below 10% indicates excellent forecasting, while values above 25% signal the need for model refinement. According to the APICS Supply Chain Council, leading organizations achieve demand forecast accuracy rates of 85-95% through continuous process improvement.
Technology plays a critical role in modern forecasting. Machine learning algorithms detect non-linear patterns in complex datasets, improving accuracy for businesses with diverse product portfolios. Cloud-based platforms integrate real-time data from ERP systems, shipping APIs, and market intelligence feeds, enabling dynamic forecast adjustments as conditions change.
At DocShipper, we leverage proprietary forecasting tools to help clients anticipate peak shipping seasons and secure optimal freight rates, ensuring containers are booked before capacity constraints drive prices higher.
Concrete Examples & Data
Consider a European electronics importer sourcing components from Shenzhen. Historical data shows 15% higher demand in Q4 due to holiday sales. By applying a seasonal forecast model in June, the company projects needing 12 additional 40-foot containers between October and December.
The importer books ocean freight three months in advance, locking in rates at $4,200 per container versus $6,800 during peak season. This forecasting-driven approach saves $31,200 in freight costs while ensuring inventory arrives before the shopping rush.
Comparative Forecast Accuracy by Method
| Forecasting Method | Typical MAPE | Best Use Case | Data Requirement |
|---|---|---|---|
| Moving Average | 18-25% | Stable demand patterns | 12+ months history |
| Exponential Smoothing | 12-18% | Gradual trend changes | 6+ months history |
| Regression Analysis | 10-15% | Correlated variables | 24+ months history |
| Machine Learning | 5-10% | Complex, high-volume data | 36+ months history |
| Expert Judgment | 20-30% | New products/markets | Minimal to none |
Use Case: Automotive Parts Distributor
A North American automotive distributor imports brake components from Thailand. Their forecast model combines historical sales data with dealer network feedback. For January-March 2024, the model predicts:
- Volume forecast: 8,500 units across three product lines
- Container requirement: Five 20-foot containers (1,700 units per container)
- Lead time buffer: Additional 15 days added for Lunar New Year disruptions
- Safety stock: 12% buffer (1,020 units) for demand variability
- Customs clearance timing: Coordinated to avoid month-end port congestion
By initiating shipments in late November, the distributor ensures inventory availability for spring maintenance season. Actual Q1 sales reached 8,320 units, yielding a forecast accuracy of 97.8% and preventing both stockouts and excess inventory holding costs.
Conclusion
Forecasting transforms logistics from reactive problem-solving into strategic advantage. Accurate projections enable optimal container bookings, warehouse utilization, and customs preparation, directly impacting profitability and customer satisfaction.
Need help developing a forecasting strategy tailored to your import/export operations? Contact DocShipper for expert guidance on demand planning and supply chain optimization.
📚 Quiz
Test Your Knowledge: Forecast
What is the primary purpose of forecasting in international logistics?
A company achieves a Mean Absolute Percentage Error (MAPE) of 22% in their demand forecast. What does this indicate?
An electronics importer notices 15% higher demand every Q4. Which forecasting approach should they apply?
🎯 Your Result
📞 Free Quote in 24hFAQ | Forecast: Definition, Calculation & Concrete Examples
Forecasting predicts future demand using statistical models and historical data, while demand planning is a broader process that incorporates forecasts, inventory policies, and operational constraints to create actionable supply plans. Forecasting provides the input; demand planning delivers the execution strategy.
Ocean freight typically requires 90-120 day forecasts to secure container space and negotiate rates, while air freight operates on shorter 30-45 day horizons. Strategic decisions like annual carrier contracts benefit from 12-18 month projections that account for seasonal fluctuations and market trends.
Critical data includes historical sales records, current order backlogs, promotional calendars, economic indicators, and supplier production schedules. Integrating external factors like weather patterns for seasonal goods or regulatory changes for compliance-sensitive products further refines predictions. Real-time port congestion data also helps adjust lead time forecasts.
Absolutely. Even basic forecasting using spreadsheet tools and simple moving averages helps small importers avoid costly expedited shipping. Starting with a 3-month rolling forecast based on the previous year's sales provides immediate value without requiring sophisticated software or dedicated analysts.
Track Mean Absolute Percentage Error (MAPE) by comparing predicted versus actual volumes. Calculate Bias to identify systematic over- or under-forecasting. Monitor Forecast Value Added (FVA) to determine if your process outperforms naive methods like using last year's actuals. Review these metrics monthly and adjust models accordingly.
Seasonal patterns significantly impact container availability and freight rates. Retailers face Q4 spikes, agricultural products follow harvest cycles, and fashion follows collection launches. Decomposing historical data into trend, seasonal, and irregular components allows forecasters to separate predictable patterns from random variation, improving accuracy.
No. Different products require tailored approaches—fast-moving consumer goods benefit from statistical models, while slow-moving industrial parts rely more on sales input. Group products by demand pattern (stable, trendy, erratic) and apply appropriate forecasting techniques. ABC classification helps prioritize forecasting effort on high-value items.
Incorporate risk scenarios into your forecast model by maintaining alternative routing plans and safety stock buffers. Monitor geopolitical news and carrier advisories to adjust lead times proactively. Collaborative forecasting with freight forwarders provides early warning of potential disruptions, allowing you to reroute shipments or accelerate orders before capacity tightens.
This approach shares demand projections with manufacturers to align production schedules and raw material procurement. By providing suppliers with 6-12 month visibility, you improve their capacity planning while securing priority allocation during high-demand periods. Many electronics and automotive companies mandate collaborative forecasting in supplier contracts.
Machine learning excels at identifying complex patterns in large datasets but lacks contextual business knowledge. Best practice combines algorithmic predictions with human expertise—algorithms generate baseline forecasts, while planners adjust for promotions, market changes, or strategic initiatives. This hybrid approach typically outperforms either method alone.
Rolling forecasts updated monthly provide the best balance between accuracy and effort. Weekly updates suit highly volatile markets or fast-moving products, while quarterly reviews suffice for stable industrial goods. Always refresh forecasts after significant market events, supplier changes, or major promotional campaigns to maintain relevance.
Improved forecasting reduces safety stock requirements, freeing cash tied up in excess inventory. A 10% accuracy improvement can decrease inventory holding costs by 5-8% while maintaining service levels. Conversely, poor forecasting leads to expedited freight charges, stockouts, and lost sales—costs that often exceed the investment in better forecasting tools and processes.
Need Help with
Logistics or Sourcing ?
First, we secure the right products from the right suppliers at the right price by managing the sourcing process from start to finish. Then, we simplify your shipping experience - from pickup to final delivery - ensuring any product, anywhere, is delivered at highly competitive prices.


Fill the Form
Prefer email? Send us your inquiry, and we’ll get back to you as soon as possible.
Contact us