In short ⚡
Fill Rate is a key performance indicator (KPI) measuring the percentage of customer orders fulfilled completely from available inventory without backorders or stockouts. It evaluates supply chain efficiency by comparing actual shipments against requested quantities, directly impacting customer satisfaction and operational costs.
Introduction
Many businesses struggle with a common dilemma: customers expect immediate product availability, yet maintaining perfect inventory levels seems impossible. This tension creates costly stockouts or excess inventory that drains resources.
The Fill Rate metric addresses this challenge by quantifying how effectively your supply chain meets demand. In international logistics, this indicator becomes critical when coordinating suppliers across continents, managing long lead times, and balancing warehousing costs against service expectations.
Understanding Fill Rate means grasping these fundamental characteristics:
- Customer-centric measurement: Reflects real service quality from the buyer’s perspective
- Inventory health indicator: Reveals gaps between demand forecasting and stock management
- Cost-impact metric: Poor Fill Rates trigger expedited shipping, lost sales, and customer churn
- Multi-level application: Can measure performance by product line, SKU, order, or warehouse location
- Actionable intelligence: Identifies specific bottlenecks in procurement, warehousing, or distribution
In-Depth Analysis & Mechanisms
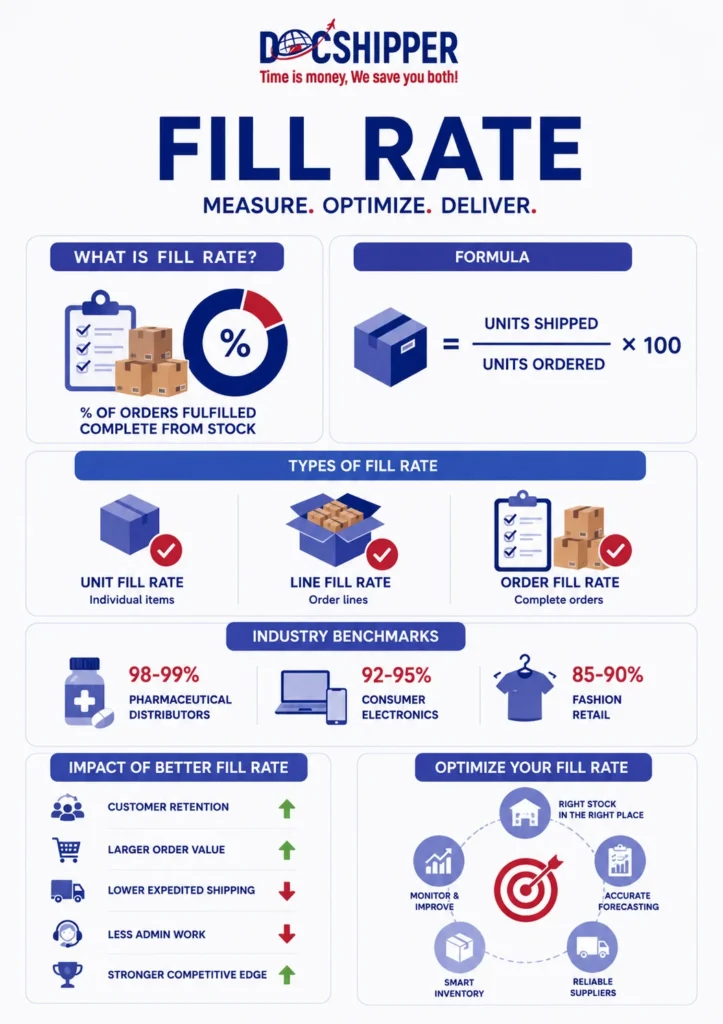
The Fill Rate calculation follows a straightforward formula: (Units Shipped / Units Ordered) × 100. However, practical application requires nuanced understanding of what constitutes “complete fulfillment” in different business contexts.
Three primary Fill Rate types exist in logistics operations. The Unit Fill Rate measures individual item fulfillment, ideal for e-commerce tracking. The Line Fill Rate evaluates complete order lines, relevant when customers order multiple products. The Order Fill Rate considers entire orders, most stringent but reflecting true customer experience.
From a regulatory perspective, Fill Rate impacts contract compliance in international trade agreements. The Incoterms rules define delivery obligations, and consistent Fill Rate failures can constitute breach of contract, particularly under DDP (Delivered Duty Paid) terms where sellers guarantee complete delivery.
The inventory positioning strategy directly influences Fill Rate performance. Companies using centralized warehouses face lower holding costs but risk geographic coverage gaps. Distributed networks improve Fill Rates through proximity but multiply complexity. At DocShipper, we analyze your order patterns to recommend optimal warehouse locations balancing cost against service levels.
Advanced operations employ safety stock calculations tied to target Fill Rates. The formula incorporates demand variability, lead time fluctuation, and desired service level. A 95% Fill Rate target requires different safety stock than 99%, with exponential cost increases at higher thresholds. This relationship explains why most industries target 93-98% rather than perfection.
Concrete Examples & Data
Industry benchmarks reveal significant Fill Rate variations across sectors. Pharmaceutical distributors typically achieve 98-99% due to critical product nature. Consumer electronics average 92-95%, balancing demand volatility against product obsolescence risk. Fashion retail often operates at 85-90% because of seasonal fluctuations and trend unpredictability.
Consider this comparative scenario across three fulfillment strategies:
| Strategy | Fill Rate | Avg. Delivery Time | Holding Costs | Best For |
|---|---|---|---|---|
| Central Warehouse | 88-92% | 4-7 days | Low | Predictable demand, cost-sensitive |
| Regional Hubs (3-5) | 94-97% | 2-3 days | Medium | Balanced approach, growing markets |
| Distributed Network | 97-99% | 1-2 days | High | Premium service, high margins |
A practical use case demonstrates Fill Rate impact: An electronics importer experienced 89% Fill Rate with monthly revenue loss of $180,000 from cancelled orders. Analysis revealed 60% of stockouts occurred in just 12 SKUs. By implementing safety stock adjustments for these items and improving supplier communication, Fill Rate increased to 96% within three months, recovering $140,000 monthly revenue at only $22,000 additional inventory cost.
The financial implications of Fill Rate improvements follow a clear pattern:
- Customer retention: Each 1% Fill Rate increase correlates with 0.5-0.8% reduction in customer churn
- Order value: Customers experiencing stockouts reduce subsequent order sizes by 15-25% on average
- Expedited shipping: Poor Fill Rates force emergency air freight, increasing logistics costs 300-500%
- Administrative burden: Each backorder generates 2.5 hours of customer service time and follow-up coordination
- Competitive positioning: 88% of B2B buyers cite Fill Rate as a top-three supplier selection criterion
When expanding internationally, DocShipper systematically evaluates your current Fill Rate performance against target market expectations, then designs supply chain configurations optimizing service levels within budget constraints. This includes supplier vetting, warehouse selection, and inventory positioning strategies.
Conclusion
Fill Rate transcends simple inventory metrics—it quantifies your ability to deliver on customer promises while balancing operational efficiency. Mastering this KPI means understanding the intricate trade-offs between stock investment, delivery speed, and customer satisfaction across international supply chains.
Need expert guidance optimizing your Fill Rate strategy for international operations? Contact DocShipper today for tailored logistics solutions that align service excellence with cost efficiency.
📚 Quiz
Test Your Knowledge: Fill Rate
What does Fill Rate primarily measure in supply chain operations?
A company achieves 99% Fill Rate consistently. What potential issue might this indicate?
An electronics importer experiences stockouts primarily in 12 out of 200 SKUs. What is the most efficient strategy to improve Fill Rate?
🎯 Your Result
📞 Free Quote in 24hFAQ | Fill Rate: Definition, Calculation & Concrete Examples
Fill Rate measures actual order fulfillment from available stock, while Service Level indicates the probability of meeting demand without stockouts during lead time. Fill Rate is retrospective (what happened), whereas Service Level is prospective (likelihood of success). Both metrics complement each other—high Service Levels should produce high Fill Rates, but external disruptions can decouple them temporarily.
Poor Fill Rates force partial shipments and backorder fulfillment, fragmenting what could be consolidated freight. This increases per-unit transportation costs by 40-70% due to lost economies of scale. Additionally, rush orders to compensate for stockouts require expensive air freight instead of economical ocean shipping, multiplying costs 3-5x while adding customs clearance complexity.
Most small importers should target 92-95% Fill Rate initially, balancing service quality against inventory investment constraints. This range satisfies most customers while avoiding the exponential safety stock costs required for 98%+ performance. As operations mature and demand patterns stabilize, gradually increase targets. Focus first on achieving consistency rather than perfection across all SKUs.
Yes—Fill Rates above 98-99% often indicate overstocking, tying up capital in slow-moving inventory and increasing obsolescence risk. This is particularly problematic for products with short lifecycles (electronics, fashion) or expiration dates (food, pharmaceuticals). The optimal Fill Rate balances service costs against holding costs, which varies by industry and product characteristics.
Seasonal demand spikes distort Fill Rate metrics if not properly contextualized. Best practice involves calculating separate baseline and peak-season Fill Rates, with lower targets accepted during unpredictable surges. Advanced forecasting models incorporate seasonality patterns, but even sophisticated systems struggle with unprecedented events. Many companies use rolling 12-month averages to smooth seasonal distortions while tracking short-term performance separately.
Your suppliers' Fill Rate directly determines your maximum achievable performance. If your supplier delivers at 90% Fill Rate, you cannot exceed that without alternative sourcing or buffer inventory. This makes supplier Fill Rate a critical evaluation criterion during sourcing decisions. Negotiate Fill Rate guarantees in contracts, with penalties for chronic underperformance incentivizing supplier reliability.
B2B operations typically emphasize Order Fill Rate (complete order fulfillment) because business customers often cannot use partial deliveries. B2C contexts prioritize Unit Fill Rate since consumers generally accept partial shipments. B2B also involves longer planning horizons and committed delivery dates, making Fill Rate a contractual obligation. B2C offers more flexibility, with customers sometimes accepting substitutions or delayed items.
Modern Warehouse Management Systems (WMS) provide real-time Fill Rate monitoring with automated alerts for declining performance. Integration with Enterprise Resource Planning (ERP) systems enables demand forecasting that anticipates stockouts before they occur. Advanced solutions employ machine learning to optimize reorder points dynamically based on evolving demand patterns, supplier reliability data, and seasonal trends, continuously improving Fill Rate while minimizing inventory investment.
Tactical improvements (adjusting safety stock on critical SKUs) show results within 4-8 weeks, one replenishment cycle. Strategic changes (supplier diversification, warehouse network redesign) require 3-6 months for full implementation. The fastest gains come from analyzing existing data to identify root causes—often just 20% of SKUs account for 80% of stockouts. Addressing these high-impact items delivers immediate Fill Rate boosts with minimal investment.
These metrics operate in tension—higher Fill Rates require more safety stock, reducing inventory turnover. Conversely, aggressive turnover targets through minimal stock increase stockout risk. Optimal balance depends on product margins and customer expectations. High-margin products justify lower turnover to maintain Fill Rates, while commodity items may accept lower Fill Rates to maximize turnover and minimize holding costs.
Customs clearance unpredictability complicates Fill Rate management for importers. Unexpected inspections or documentation issues extend lead times, depleting inventory before replenishment arrives. Smart importers build customs-delay buffers into safety stock calculations, typically adding 3-7 days depending on port congestion and product classification risk. Working with experienced customs brokers who expedite clearance protects Fill Rates from regulatory disruptions.
Absolutely—differentiated Fill Rate targets optimize overall profitability. High-velocity, high-margin products warrant 97-99% targets to maximize sales capture. Slow-moving or low-margin items may operate at 85-90% Fill Rates to avoid excessive inventory investment. This segmented approach, called ABC analysis in inventory management, allocates resources proportionally to business impact rather than applying uniform standards that either overinvest in minor products or underserve critical ones.
Need Help with
Logistics or Sourcing ?
First, we secure the right products from the right suppliers at the right price by managing the sourcing process from start to finish. Then, we simplify your shipping experience - from pickup to final delivery - ensuring any product, anywhere, is delivered at highly competitive prices.


Fill the Form
Prefer email? Send us your inquiry, and we’ll get back to you as soon as possible.
Contact us