In short ⚡
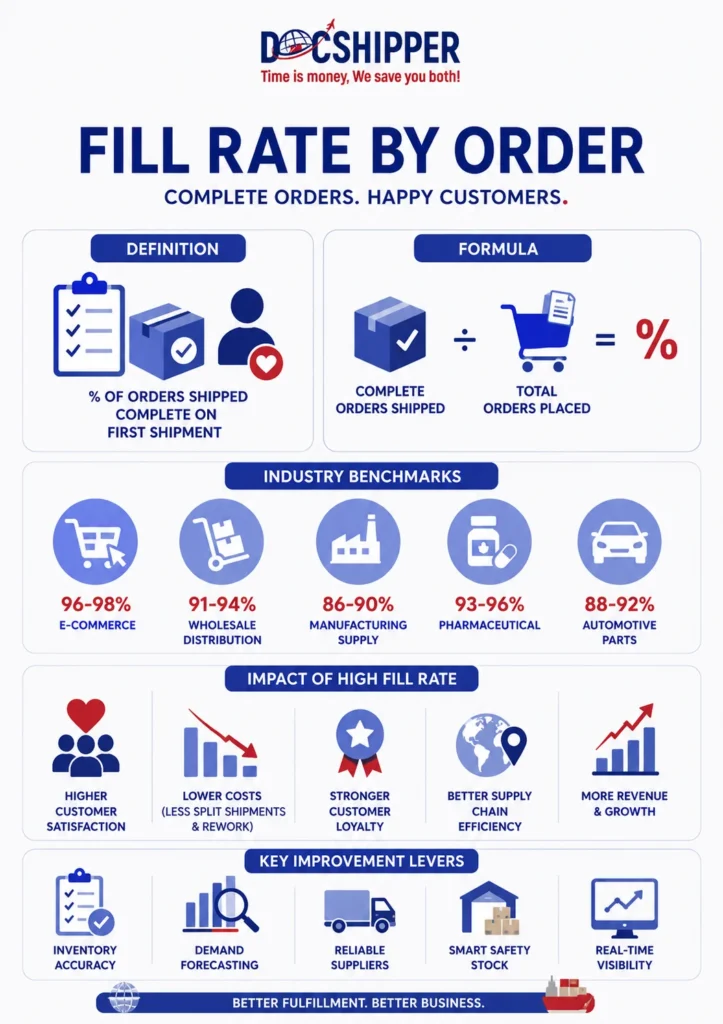
Fill Rate by Order measures the percentage of complete customer orders shipped without any stockouts or backorders. It evaluates how many orders are fulfilled in their entirety on the first shipment, serving as a critical KPI for supply chain efficiency and customer satisfaction in international logistics.
Introduction
Many businesses confuse partial shipments with successful order fulfillment. A company might ship 90% of items but deliver only 60% of orders completely—creating customer frustration and hidden logistics costs.
In import-export operations, Fill Rate by Order directly impacts customer retention, transportation efficiency, and warehouse productivity. Unlike line-item fill rates that measure individual SKUs, this metric focuses on the complete customer experience.
Key characteristics of Fill Rate by Order include:
- Order completion focus: Measures whole orders, not individual products
- First-time fulfillment: Counts only initial shipments without backorders
- Customer-centric metric: Reflects actual delivery experience
- Supply chain efficiency indicator: Reveals inventory management effectiveness
- Cost impact visibility: Highlights expenses from split shipments and re-deliveries
Understanding Fill Rate Mechanisms & Strategic Impact
The fundamental calculation distinguishes Fill Rate by Order from other fulfillment metrics. The formula is: (Number of Complete Orders Shipped / Total Orders Placed) × 100. An order qualifies as “complete” only when every requested item ships in full quantities on the initial dispatch.
Three factors significantly influence this metric. Inventory accuracy ensures system records match physical stock, preventing promise failures. Demand forecasting precision aligns stock levels with customer orders, especially critical for seasonal imports. Supplier reliability affects international shipments where delays cascade through the fulfillment chain.
From a regulatory perspective, the International Chamber of Commerce emphasizes that Incoterms directly impact fill rate calculations. DDP (Delivered Duty Paid) terms place complete responsibility on sellers, making high fill rates essential for contract compliance.
The order-level measurement reveals hidden costs that line-item rates obscure. When orders split into multiple shipments, businesses incur duplicate transportation, handling, and customs documentation expenses. For international operations, each additional shipment triggers separate duty assessments and clearance procedures.
At DocShipper, we implement pre-shipment inventory verification protocols that cross-reference purchase orders against warehouse stock before confirming customer deliveries. This proactive approach has helped clients improve their fill rates by 15-30% within six months, eliminating costly partial shipments and reducing customer complaints.
Technology integration transforms fill rate management. Modern Warehouse Management Systems (WMS) now incorporate real-time inventory tracking with automated order allocation algorithms. These systems prioritize complete order fulfillment over partial shipments, dynamically reserving stock for pending orders rather than fragmenting inventory across multiple partial fulfillments.
Concrete Examples & Performance Benchmarks
Industry performance standards vary significantly by sector. According to 2024 logistics benchmarking data, top-performing e-commerce companies achieve 95-98% fill rates by order, while traditional B2B distributors average 85-90%. Manufacturing sectors with complex BOMs (Bills of Materials) typically range between 75-85%.
Comparative Performance Analysis
| Industry Sector | Average Fill Rate | Top Performer Range | Primary Challenge |
|---|---|---|---|
| E-commerce (B2C) | 92-95% | 96-98% | SKU proliferation |
| Wholesale Distribution | 85-90% | 91-94% | Large order volumes |
| Manufacturing Supply | 78-85% | 86-90% | Complex component dependencies |
| Pharmaceutical | 88-92% | 93-96% | Regulatory compliance demands |
| Automotive Parts | 82-87% | 88-92% | JIT inventory constraints |
Real-World Case Study: Electronics Import Scenario
A European electronics retailer importing from Asia faced consistent 73% fill rates causing customer dissatisfaction. Analysis revealed three critical failure points:
Scenario baseline: The company received 1,000 customer orders monthly. Initial performance showed only 730 complete orders, with 270 requiring follow-up shipments. Each partial fulfillment added €45 in handling and shipping costs.
Cost calculation: Monthly additional expense = 270 split orders × €45 = €12,150. Annually, incomplete orders generated €145,800 in avoidable costs, excluding customer churn impacts.
Solution implementation: The retailer implemented safety stock buffers for high-velocity items, upgraded their forecasting algorithms, and established supplier performance penalties. Within nine months, fill rates improved to 91%, reducing split shipments to 90 monthly and saving approximately €97,200 annually.
Calculation Example with International Variables
Consider a textile importer processing monthly orders with customs complexities:
- Total orders received: 850
- Orders fully shipped: 748
- Orders requiring backorders: 102 (delayed by customs or inventory gaps)
- Fill Rate by Order: (748 ÷ 850) × 100 = 88%
The 12% fulfillment gap represents 102 customer experiences requiring additional communication, expedited shipping, and potential relationship damage. If average order value is $2,400, that 12% represents $244,800 in at-risk revenue monthly.
Key improvement levers identified include pre-clearance documentation review, buffer stock for customs-sensitive items, and multi-origin sourcing to mitigate single-supplier dependencies affecting complete order fulfillment.
Conclusion
Fill Rate by Order serves as the ultimate measure of supply chain reliability, directly translating inventory management and forecasting accuracy into customer satisfaction. For international logistics operations, maintaining high performance requires coordinated efforts across procurement, warehousing, customs clearance, and transportation.
Need expert guidance optimizing your order fulfillment metrics across international supply chains? Contact DocShipper for a comprehensive assessment of your logistics performance and actionable improvement strategies.
📚 Quiz
Test Your Knowledge: Fill Rate by Order
1. What does Fill Rate by Order specifically measure?
2. A company ships 95% of all ordered items but only 78% of orders are complete. Should backorders that are eventually fulfilled count toward the Fill Rate by Order?
3. An electronics importer receives 1,000 orders monthly and ships 850 completely on first dispatch. What is their Fill Rate by Order?
🎯 Your Result
📞 Free Personalized QuoteFAQ | Fill Rate by Order: Definition, Calculation & Concrete Examples
Line Fill Rate measures the percentage of individual product lines shipped completely, while Fill Rate by Order evaluates whether entire customer orders ship without missing items. A company might achieve 95% Line Fill Rate but only 80% Fill Rate by Order if many orders contain one or two unavailable items. The order-level metric better reflects customer experience since receiving 90% of an order still means an incomplete delivery requiring follow-up.
Customs clearance delays impact fill rates when they cause partial order releases. If customs holds specific items for inspection or documentation issues while releasing others, the order splits into multiple shipments. Best practice measures fill rate at the point of warehouse dispatch rather than final delivery, making pre-shipment customs verification critical for maintaining high performance in international operations.
International logistics operations typically target 90-95% fill rates by order, acknowledging additional complexities like supplier lead time variability, customs uncertainties, and multi-country sourcing challenges. Domestic operations often achieve 95-98%. Rates below 85% indicate systemic inventory management or forecasting problems requiring immediate attention, as they generate excessive costs and customer dissatisfaction.
No, backorders should never count toward fill rate calculation. The metric specifically measures first-time complete fulfillment. Including backorders inflates performance artificially and masks underlying inventory problems. A separate metric—"ultimate fill rate"—can track eventual fulfillment including backorders, but the primary fill rate by order must reflect initial shipment completeness to drive meaningful operational improvements.
Order complexity—measured by number of distinct SKUs and total quantity—inversely correlates with fill rate. Orders containing 10+ different items have statistically lower complete fulfillment probability than single-item orders. Successful operations segment analysis by order complexity, setting differentiated targets: 98% for 1-3 item orders, 92% for 4-10 items, and 85% for complex orders exceeding 10 SKUs.
Yes, through strategic approaches: ABC analysis concentrates safety stock on high-velocity items driving most orders; improved demand forecasting reduces excess slow-moving inventory while ensuring fast-mover availability; supplier collaboration with VMI (Vendor Managed Inventory) transfers holding costs while maintaining availability; and order promising systems that confirm stock before accepting orders prevent impossible fulfillment commitments.
Seasonal demand spikes typically reduce fill rates by 5-15% unless properly anticipated. Import operations face amplified challenges due to extended lead times preventing rapid replenishment. Effective seasonal management requires forecast adjustments 90-120 days pre-season for international sourcing, strategic buffer stock building, and supplier capacity commitments. Post-season analysis should normalize fill rate performance against demand volatility rather than treating all periods equally.
Order batching—holding orders until complete inventory availability—can artificially inflate fill rates while degrading delivery speed. This practice trades fulfillment completeness for customer wait time. Modern best practice prioritizes speed with high natural fill rates through inventory optimization rather than delaying shipments. For B2B operations with scheduled delivery windows, strategic batching within customer-acceptable timeframes can balance both objectives effectively.
Industry standard excludes substitutions from positive fill rate contribution unless customer explicitly pre-approves alternatives. Shipping substitute items without confirmation constitutes incomplete fulfillment even if functional equivalents exist. Advanced operations implement "acceptable substitute" programs where customers pre-authorize specific alternatives, allowing these to count toward fill rate when original items are unavailable, but documentation and customer agreement are essential.
Integrated WMS (Warehouse Management Systems) with real-time inventory visibility form the foundation, connecting to ERP systems for demand forecasting and purchase order management. Advanced implementations add ATP (Available-to-Promise) engines that reserve inventory for pending orders, preventing overselling. Machine learning forecasting modules analyze historical patterns including seasonality and trends. For international operations, customs management systems providing clearance status visibility prevent surprise inventory unavailability.
Research shows incomplete orders reduce repeat purchase probability by 25-40% depending on industry. Customers experiencing split shipments demonstrate 15-20% lower lifetime value than those consistently receiving complete orders. The impact compounds: first incomplete order reduces retention 10%, second by 25%, third by 45%. For subscription or contractual relationships, fill rate performance often appears explicitly in service level agreements with financial penalties for underperformance.
Standard methodology excludes expedited shipments arranged after order placement to correct initial unavailability. If a company ships 70% of an order initially, then expedites the remaining 30%, this counts as incomplete fulfillment. The metric must reflect normal operational capability, not emergency intervention. However, pre-planned expedited shipping for specific customer segments (overnight service, for example) counts positively when all items ship together as originally promised.
Need Help with
Logistics or Sourcing ?
First, we secure the right products from the right suppliers at the right price by managing the sourcing process from start to finish. Then, we simplify your shipping experience - from pickup to final delivery - ensuring any product, anywhere, is delivered at highly competitive prices.


Fill the Form
Prefer email? Send us your inquiry, and we’ll get back to you as soon as possible.
Contact us