
In short ⚡
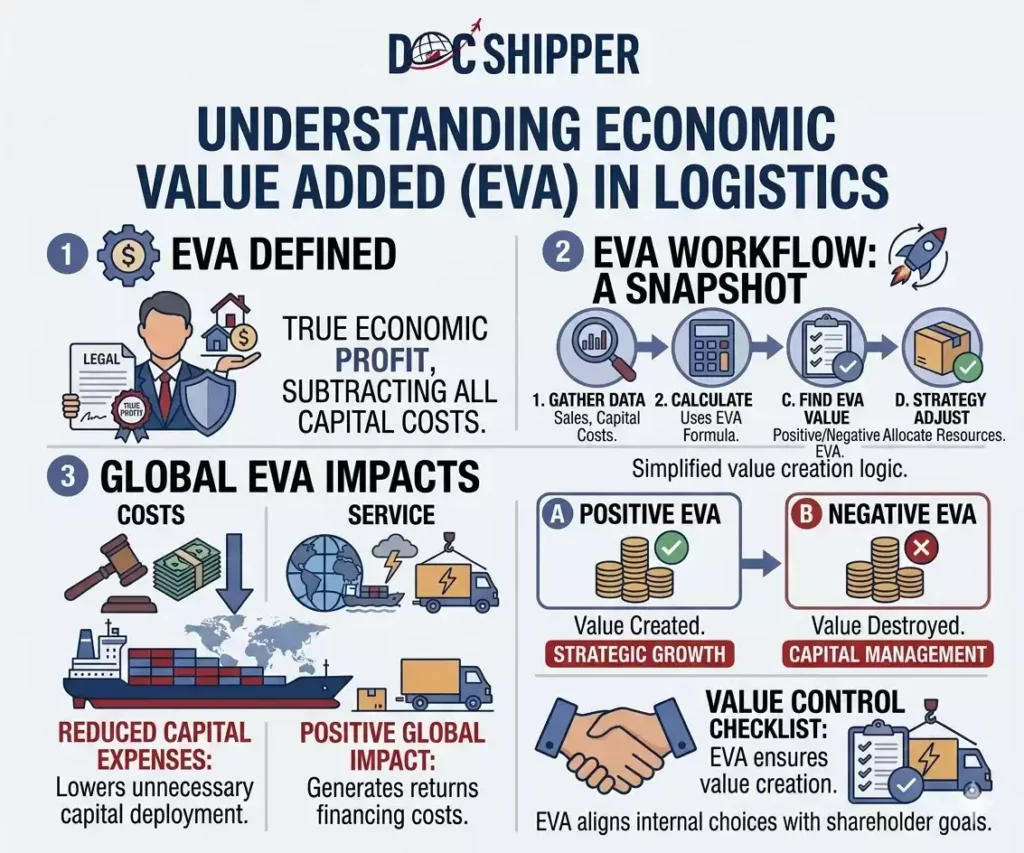
Economic Value Added (EVA) is a financial performance metric measuring a company's true economic profit by subtracting the cost of capital from net operating profit after taxes. It reveals whether operations generate value beyond investor expectations, making it crucial for assessing profitability in logistics and international trade businesses.Introduction
Many logistics companies appear profitable on paper yet fail to satisfy stakeholders. Traditional accounting metrics like net income often mask a critical reality: the true cost of capital deployed. This gap creates confusion when evaluating whether import/export operations genuinely create wealth or simply consume resources inefficiently.
In international supply chain management, understanding EVA becomes essential. Freight forwarding, customs brokerage, and warehousing operations require significant capital investments. Without proper measurement, businesses cannot distinguish between profitable growth and value-destroying expansion. EVA provides the clarity needed for strategic decisions in competitive logistics markets.
Key characteristics defining Economic Value Added include:
- Capital cost consideration: Accounts for both debt and equity financing expenses
- Performance alignment: Links operational decisions to shareholder value creation
- Strategic clarity: Identifies which services or routes generate genuine returns
- Resource optimization: Guides capital allocation across warehouses, fleets, and infrastructure
- Incentive structure: Enables performance-based compensation tied to value creation
In-Depth Analysis & Strategic Implications
The fundamental EVA formula subtracts the dollar cost of capital from Net Operating Profit After Taxes (NOPAT). Mathematically: EVA = NOPAT – (Capital × WACC), where WACC represents the Weighted Average Cost of Capital. This calculation forces managers to recognize that capital has a price, whether borrowed or equity-financed.
In logistics operations, capital intensity varies dramatically. A digital freight platform requires minimal physical assets, while a container shipping line ties billions in vessels and equipment. EVA reveals whether these capital deployments earn returns exceeding their cost. A positive EVA signals wealth creation; negative EVA indicates value destruction despite accounting profits.
The NOPAT calculation starts with operating income, adjusts for taxes, and excludes financing costs already captured in WACC. For freight forwarders, this means focusing on margin from transportation, warehousing, and customs services—before interest expenses. Adjustments may include capitalizing operating leases or R&D investments to reflect economic reality versus accounting conventions.
WACC determination combines the cost of debt (after tax benefits) and equity (expected shareholder returns) weighted by their proportions in capital structure. According to Federal Reserve data, logistics firms typically carry WACC rates between 7-12% depending on leverage and market conditions. Higher risk operations like emerging market forwarding command premium rates.
Strategic implications extend beyond measurement. Companies can improve EVA by increasing NOPAT through operational efficiency—optimizing routes, automating customs processing, or negotiating better carrier rates. Alternatively, reducing capital employed through asset-light models or improved inventory turnover achieves similar results. At DocShipper, we systematically analyze client operations to identify which shipment routes and service combinations maximize EVA, enabling data-driven expansion decisions.
The market value added (MVA) concept extends EVA by measuring cumulative value creation over time. MVA equals market capitalization minus invested capital, representing the present value of all future expected EVA streams. Logistics investors increasingly use MVA to compare freight forwarders, 3PLs, and integrated providers, recognizing that sustainable competitive advantage translates into consistent positive EVA generation across economic cycles.
Concrete Examples & Performance Data
Consider two freight forwarding companies with identical $10 million revenue and $1 million net income. Company A operates with $8 million capital at 10% WACC ($800K capital charge). Company B uses $12 million capital with the same WACC ($1.2M capital charge). Company A generates $200K EVA while Company B destroys $200K value—despite equal accounting profits. This illustrates how capital efficiency separates winners from losers.
Real-world application in warehouse investment decisions demonstrates EVA’s power. A 3PL considering a $5 million automated sortation system expects $800K annual NOPAT improvement. With 9% WACC, the capital charge equals $450K annually. The project delivers $350K positive EVA, justifying investment. Without EVA analysis, managers might approve projects based solely on payback period, potentially destroying shareholder value.
Industry benchmarks reveal performance variations:
| Logistics Segment | Average ROIC | Typical WACC | EVA Spread |
|---|---|---|---|
| Digital Freight Platforms | 18-22% | 11-13% | +7 to +9% |
| Asset-Light Forwarders | 14-17% | 8-10% | +5 to +7% |
| Trucking Fleets | 9-12% | 7-9% | +2 to +3% |
| Ocean Carriers | 6-15%* | 8-10% | -2 to +5%* |
*Highly cyclical, varies dramatically with freight rates
A practical route profitability analysis using EVA clarifies expansion strategy. An Asia-Europe forwarder evaluates opening a Latin America division. Projected annual NOPAT: $600K. Required capital for offices, staff, and working capital: $4 million. At 10% WACC, capital charge equals $400K. The venture generates $200K positive EVA, signaling viable expansion despite modest accounting returns.
Key operational drivers of EVA in logistics include:
- Load optimization: Maximizing container utilization directly improves NOPAT without additional capital
- Payment terms: Reducing Days Sales Outstanding decreases working capital requirements
- Technology leverage: Automation systems increase throughput per dollar of invested capital
- Asset turnover: Higher shipment velocity through warehouses improves capital efficiency
- Service mix: Higher-margin customs brokerage or insurance services boost NOPAT on existing capital base
DocShipper applies EVA principles when designing client solutions. Rather than simply maximizing revenue, we structure services to optimize your capital deployment—selecting routes, carriers, and warehousing strategies that generate genuine economic value, not just accounting profits.
Conclusion
Economic Value Added transcends traditional accounting metrics by revealing whether logistics operations truly create wealth. In capital-intensive international trade, EVA separates sustainable business models from those merely appearing profitable while destroying shareholder value.
Need help optimizing your supply chain’s economic performance? Contact DocShipper for strategic analysis that aligns operational decisions with value creation.
📚 Quiz
Test Your Knowledge: Economic Value Added (EVA)
1. What does Economic Value Added (EVA) primarily measure in logistics operations?
2. A freight forwarding company reports $500K net income on $8 million capital with 10% WACC. What is the true EVA situation?
3. When evaluating a $5M warehouse automation investment with $800K annual NOPAT improvement and 9% WACC, which decision creates value?
🎯 Your Result
📞 Free Customized QuoteFAQ | Economic Value Added (EVA): Definition, Calculation & Concrete Examples
While ROI compares profits to invested capital as a percentage, EVA calculates absolute dollar value created after deducting all capital costs. ROI may show 15% returns, but if your WACC is 12%, EVA reveals only 3% spread. EVA also adjusts for accounting distortions, providing clearer economic reality. In logistics, this distinction matters when comparing asset-heavy carriers to asset-light forwarders with different capital structures.
Absolutely. This occurs when operating profits fail to exceed the total cost of capital employed. A freight forwarder earning $500K net income on $8 million capital with 10% WACC actually destroys $300K value annually ($500K profit - $800K capital charge). This situation signals inefficient capital use and demands strategic correction through improved margins or capital reduction.
Most established freight forwarders operate with WACC between 8-11%, varying by leverage, market position, and geographic risk exposure. Asset-light digital platforms may see 11-13% due to growth investor expectations. Companies operating in emerging markets often face 12-15% WACC reflecting country and currency risks. Accurate calculation requires weighting debt cost (after tax) and equity cost by their capital structure proportions.
Three primary levers exist: increase NOPAT through operational efficiency (route optimization, technology adoption, service mix enhancement), reduce capital employed (asset-light models, improved working capital management, strategic outsourcing), or lower WACC through optimal capital structure. Most logistics firms find the greatest opportunity in operational improvements and working capital efficiency before restructuring financing.
Yes, EVA principles scale to micro-level decisions. Allocate capital employed (working capital, equipment, facility costs) to specific lanes or customers, calculate their NOPAT contribution, and subtract allocated capital charge. This reveals which relationships genuinely create value. Many forwarders discover that their largest customers actually destroy value when full capital costs are considered, prompting strategic repricing or exit.
Market capitalization theoretically equals invested capital plus the present value of all future EVA. Consistently positive EVA companies trade at premiums above book value (positive MVA), while chronic EVA destroyers trade below. Investors analyzing DHL, Kuehne+Nagel, or regional forwarders increasingly use EVA trends to predict stock performance, recognizing it as a leading indicator of sustainable competitive advantage.
Common adjustments include capitalizing operating leases (converting rental expenses to owned asset equivalents), adjusting for goodwill amortization, and treating R&D or training as investments rather than expenses. For logistics firms, significant adjustments often involve warehouse leases and technology development costs. These modifications align accounting figures with economic reality, though excessive adjustments can reduce comparability across companies.
Precisely. Calculate the automation system's capital cost, estimate annual NOPAT improvement (labor savings, throughput gains, error reduction), subtract the capital charge (investment × WACC), and compare resulting EVA to current operations. Positive incremental EVA justifies investment; negative signals value destruction despite potential ROI or payback metrics. This approach prevents technology investments that appear attractive but actually harm shareholder value.
When pricing warehousing or fulfillment contracts, calculate required NOPAT by adding desired EVA to allocated capital charge. If a contract requires $2 million capital (facility, equipment, working capital) at 9% WACC, that's $180K capital charge. To generate $50K EVA, you need $230K NOPAT minimum. This ensures pricing covers not just operating costs and accounting profit, but true economic value creation for the specific capital deployed.
Key mistakes include incorrect WACC calculation (using debt cost instead of weighted average), improper capital allocation to business units, excessive accounting adjustments reducing transparency, and focusing solely on EVA while ignoring growth opportunities. Some firms also err by applying uniform WACC across diverse operations with different risk profiles—ocean freight versus last-mile delivery require distinct capital cost assumptions.
Most firms calculate EVA annually for performance reviews and strategic planning, with quarterly assessments for publicly traded companies. However, EVA principles should inform daily operational decisions—route selection, customer acceptance, service pricing—even without formal calculation. Leading 3PLs incorporate EVA frameworks into their business intelligence systems, providing real-time visibility into which operations create versus destroy value as conditions change.
Early-stage ventures often show negative EVA during growth phases as they build market position and infrastructure. However, EVA remains valuable by quantifying the value gap requiring closure and establishing clear performance targets. Investors in logistics startups increasingly use projected EVA turning points to evaluate business models, recognizing that path to positive EVA separates viable ventures from perpetual cash consumers regardless of revenue growth.
Need Help with
Logistics or Sourcing ?
First, we secure the right products from the right suppliers at the right price by managing the sourcing process from start to finish. Then, we simplify your shipping experience - from pickup to final delivery - ensuring any product, anywhere, is delivered at highly competitive prices.


Fill the Form
Prefer email? Send us your inquiry, and we’ll get back to you as soon as possible.
Contact us 


:%20Definition,%20Calculation%20&%20Concrete%20Examples)